4.1 Introduction to Linear Functions
Pre-Class Work
Go to Linear equations and graphs: FAQ (Open in new window) in Khan Academy and complete the exercises corresponding to the questions below. Make note of questions you have to ask about in class.
What is slope?
What are horizontal and vertical lines?
What are x and y intercepts?
If you need a review to successfully complete these exercises, watch one or more of the videos below and/or read the following review.
Shorter one (~7 min.):
Longer one (~30 min.):
Review of Linear Equations (click the triangle/arrow to expand)
Recall the slope of the line through the points [latex](x_{1},y_{1})[/latex] and [latex](x_{2},y_{2})[/latex] is [latex]m=\frac{y_{2}-y_{1}}{x_{2}-x_{1}}[/latex]
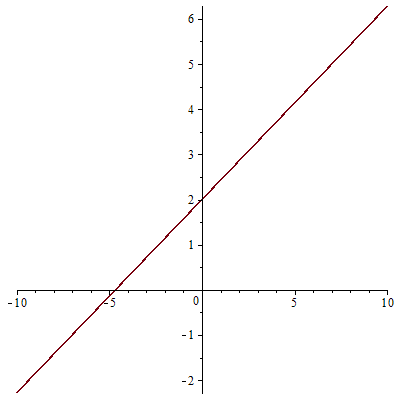
Example: Find the equation of the line through the points (7, 5) and (-7, -1) and then graph it.
Solution: The slope is [latex]m=\frac{y_{2}-y_{1}}{x_{2}-x_{1}}=\frac{-1-5}{-7-7}=\frac{-6}{-14}=\frac{3}{7}[/latex]. So we know that our equation looks like [latex]y=\frac{3}{7}x+b[/latex]. Now we just need to find b which we can do by plugging in either of the given points on the line. Let’s use (7, 5). So we plug in [latex]x = 7[/latex] and [latex]y = 5[/latex] and solve for b as follows:
[latex]5=\frac{3}{7}(7)+b[/latex] so [latex]5=3+b[/latex] and [latex]b = 2[/latex]. So our final equation is [latex]y=\frac{3}{7}x+2[/latex].
Now let’s graph it!
There are many ways in which we can do this. One way is to simply plot the two points given and draw a straight line through them. Another way is to first plot the y-intercept (0,2) and then use the slope to get another point as follows:
\frac{\textit{change in y}}{\textit{change in x}}=\frac{\textit{rise}}{\textit{run}}=\frac{3}{7} so, starting at (0,2) we go up 3 then to the right 7 and plot another point on the line. Observe that [latex]\frac{3}{7}=\frac{-3}{-7}[/latex] so we can also go down 3 and to the left 7 to plot another point on the line. Either way, once we have two points, we can simply connect them with a straight line to get the graph as shown.

Intercepts are important points on a graph. The y-intercept is where the graph intersects the y-axis and the x-intercept is where the graph intersects the x-axis.
We can see the y-intercept of the graph above is (0,2) but what is the x-intercept? Looking at the graph we see that it is close to (-5, 0) but what is it exactly?
Observe [latex]y = 0[/latex] for any x-intercept so we can find the x-intercept by setting [latex]y = 0[/latex] in the equation we found, and solving for x as follows:
[latex]0=\frac{3}{7}x+2[/latex]
[latex]-2=\frac{3}{7}x[/latex]
[latex]x=(-2)\frac{7}{3}=\frac{-14}{3}\approx-4.7[/latex]
So the x-intercept of the line above is [latex](\frac{-14}{3},0)\approx (-4.7,0)[/latex].
Linear Functions and Growing Patterns
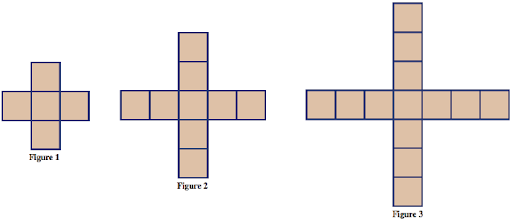
Recall the growing pattern below.

| Figure number (n) (input) | 1 | 2 | 3 | 4 | 5 | … | n |
|---|---|---|---|---|---|---|---|
| number of tiles (T) (output) | 1 | 4 | 7 | 10 | 13 | … | 3n – 2 |
The number of tiles increases by the same amount, 3, from one figure to the next. In particular, as the figure number increases by 1, the number of tiles increases by 3. So the rate of change of the total number of tiles is 3 (for each unit increase in the figure number). This rate of change/slope is constant, which is what makes this relationship (between the figure number and the number of tiles in the figure) a linear function (the graph forms a line).
We may write this relationship as [latex]y = 3x - 2[/latex], where x represents the figure number and y represents the number of tiles in figure x. Now this should look more familiar to you as a linear function from your past knowledge.
In general, when we establish a relationship between two quantities in which the rate of change is constant, we categorize that relationship as linear. Let us review the formal definition of a linear function.
A linear function is one that can be written in the form [latex]y = mx + b[/latex] where m and b are constant. m is the slope and (0,b) is the y-intercept of the line (that is, where the graph intersects the y-axis).
4.1 Examples
Example 4.1.1
Consider the growing pattern blow.

a) Determine a linear equation in the form y = mx + b, where x represents the figure number and y represents the number of tiles in figure x.
b) State the rate of change/slope and what it means in terms of the pattern.
c) State the y-intercept and what it means in terms of the pattern.
Example 4.1.2
Consider the growing pattern below.

d) Determine a linear equation in the form y = mx + b, where x represents the figure number and y represents the number of tiles in figure x.
e) State the rate of change/slope and what it means in terms of the pattern.
f) State the y-intercept and what it means in terms of the pattern.
Example 4.1.3
Connection with Arithmetic Sequences: Subsection: Arithmetic Sequences. Read and work through the corresponding “checkpoint” exercises.
The slope of a function from one input value to another input value is the change in corresponding output values divided by the change in the given input values (often known as the change in y divided by the change in x or "rise over run"). Graphically, the slope gives the steepness of the line through the two corresponding points.
a statement (with an equal sign) asserting that two expressions have the same numerical value
The y-intercept of function is the point at which the graph of the function intersects the y-axis (where x = 0).
The x-intercept of function is the point at which the graph of the function intersects the x-axis (where y = 0).
A function whose graph is a straight line (constant slope). Such functions may be written in the form y = mx+b where m is the slope and (0,b) is the y-intercept.
The average rate of change of a function from one input value to another input value is calculated the same as the slope and it is a measure of how much the function changes per input unit, on average, between the given input values.

