5.2 Quadratic Functions & Models
Pre-Class Work
- Watch this short video (below) on linear vs quadratic equations and create some of your own examples to share in class.
- Read and work through checkpoint exercises at the following links as needed for review on solving quadratic equations. This pre-class work will be needed later in the section when we address x-intercepts of quadratic functions.
Subsection: Solving Quadratic Equations by Factoring
Note that although we will focus on quadratics that can be factored, not all quadratics can be factored which is one reason why the quadratic formula is so important.
We introduce this section by revisiting a growing pattern (from chapter 2) that may be modeled by a quadratic relationship. Later in the section we will address quadratic functions more formally.
5.2 Examples
Example 5.2.1
Consider the growing pattern below.

Below are some pictures that students drew to describe how the pattern was growing.


Use the students’ pictures above (or your own method of seeing the growing pattern) to answer the following questions. Explain how you got your answers.
- How many tiles would you need to build the 5th figure in the pattern?
- How many tiles would you need to build the 10th figure in the pattern?
- How can you compute the number of tiles in any figure in the pattern?
Hy looked at the pattern in a different way by doubling each figure to build rectangles as follows:

- Draw similar pictures for figure 4 and figure 5 and use the dimensions of the rectangles to determine the number of tiles in these figures in the original pattern.
- Use the dimensions of the corresponding rectangle to calculate the number of tiles needed to build the 10th figure and the 100th figure in the pattern.
- Write a formula that calculates the number of tiles in figure n. Sketch a corresponding figure below.
Discussion: How might you show/describe this pattern to a visually impaired student?
Example 5.2.2
Break up into pairs/groups – instructor handout snap blocks
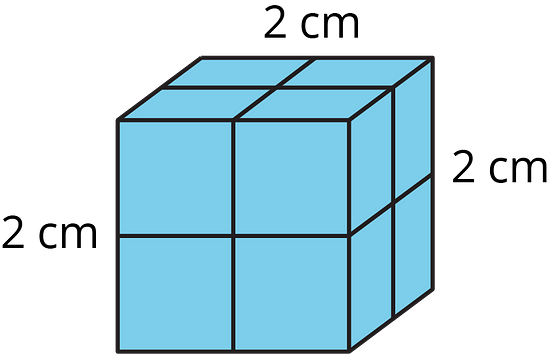
Consider a 2 by 2 by 2 cube (length = 2, height = 2 and width = 2) made up of 8 unit blocks (1 by 1 by 1) as shown above.
Observe that if the cube is dipped in paint then each of the unit blocks has 3 of its faces painted.
Build this with your snap cubes to understand.
a) Build a 3 by 3 by 3 cube in your groups using snap blocks. If this 3 by 3 by 3 cube is dipped in paint, the corresponding unit blocks used to build it may have paint on 3, 2, 1 or 0 faces as shown in the picture below.
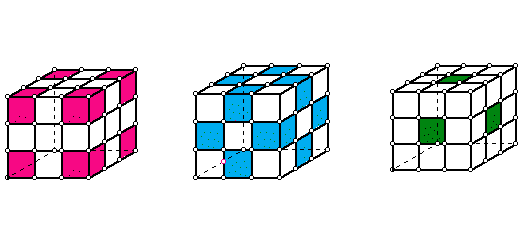
The cube on the left has shaded/colored the corner unit blocks which are each painted on 3 faces.
The cube in the center has shaded/colored the unit blocks between the corners, which are each painted on 2 faces.
The cube on the right has shaded/colored the unit blocks in the middle of each face, which are each painted on 1 face.
Determine the following…
Number of unit blocks painted on 3 faces =
Number of unit blocks painted on 2 faces =
Number of unit blocks painted on 1 face =
Number of unit blocks painted on 0 faces =
b) Now build a 4 by 4 by 4 cube. If this 4 by 4 by 4 cube is dipped in paint, determine the following (using snap blocks and the picture below to help).
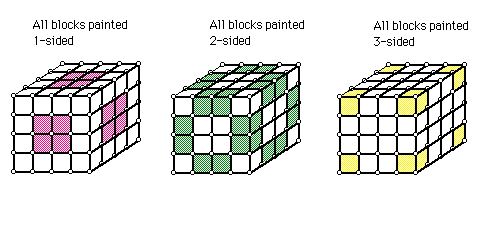
Number of unit blocks painted on 3 faces =
Number of unit blocks painted on 2 faces =
Number of unit blocks painted on 1 face =
Number of unit blocks painted on 0 faces =
c) Using the information above and, assuming similar scenarios with larger cubes, fill in the table below:
| Dimension of cube | Number of unit blocks painted on 3 faces | Number of unit blocks painted on 2 faces | Number of unit blocks painted on 1 face | Number of unit blocks painted on 0 faces | Total number of unit blocks |
| 2 | 8 | 0 | 0 | 0 | 8 |
| 3 | |||||
| 4 | |||||
| 5 | |||||
| 10 | |||||
| n |
d) Considering your results in the last row of the table, name the type of functional relationship (linear, quadratic, other) between n and each of the following, and discuss why each answer makes sense.
Number of unit blocks painted on 3 faces
Number of unit blocks painted on 2 faces
Number of unit blocks painted on 1 face
Number of unit blocks painted on 0 faces
Now we formally define quadratic functions and explore some properties.
A quadratic function is one that may be expressed in the form [latex]y=ax^{2}+bx+c[/latex] where a, b and c are real number constants and [latex]a\neq0[/latex].
Recall linear function form [latex]y=mx+b[/latex].
What is the difference between a linear and a quadratic function (in terms of the equation)?
There are three main forms of quadratic functions:
- General/expanded form: [latex]y=ax^{2}+bx+c[/latex]
- Standard/vertex form: [latex]y=a(x-h)^{2}+k[/latex]
- Factored form: [latex]y=a(x-?)(x-?)[/latex]
Illustration
Quadratic functions in various forms (state the form next to each one)
a) [latex]y=2(x-1)^{2}-2[/latex]
b) [latex]y=2x^{2}+8x+5[/latex]
c) [latex]y=-2(x-3)(x+2)[/latex]
What do graphs of quadratic functions look like? Sketch below. What are they called?
Illustration
Quadratic functions in various forms (state the form next to each one)
a) [latex]y=2(x-1)^{2}-2[/latex]
b) [latex]y=2x^{2}+8x+5[/latex]
c) [latex]y=-2(x-3)(x+2)[/latex]
What do graphs of quadratic functions look like? Sketch below. What are they called?
Terminology
The vertex of a quadratic function is the lowest or highest point on the parabola depending on whether the graph opens up or down. Mark vertex on sketches above.
The axis/line of symmetry is the vertical line that goes through the vertex. The parabola is a mirror image of itself through this line. If the vertex is (h, k) then the axis of symmetry is x = h.
Recall…..
y-intercept: point where x = 0. To find it we can set x = 0 and solve for y, then the point (0,y) will be the y-intercept.
x-intercept: a point where y = 0. To find it we can set y = 0 and solve for x, then the point (x,0) will be an x-intercept.
Note that intercepts are points (ordered pairs), not single values!
Questions for discussion
Does every parabola have a y-intercept? Can there be more than one y-intercept? Explain your reasoning.
Does every parabola have x-intercepts? How many x-intercepts can a parabola have? Explain your reasoning.
Example 5.2.3
The following exercise is a modified version of a problem designed for middle school students, from Connected Mathematics, Frogs, Fleas and Painted Cubes: Quadratic Relationships (Lappan, Fey, Fitzgerald, Friel & Phillips, 1998).
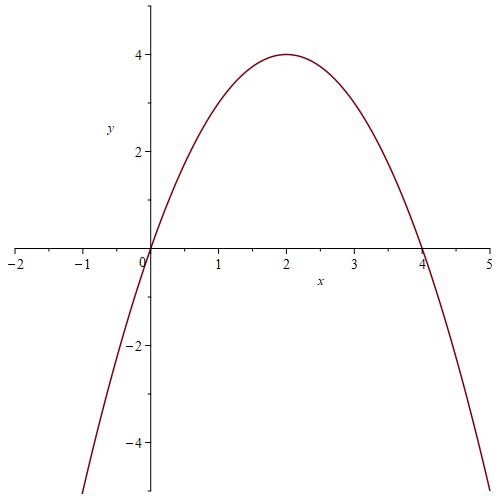
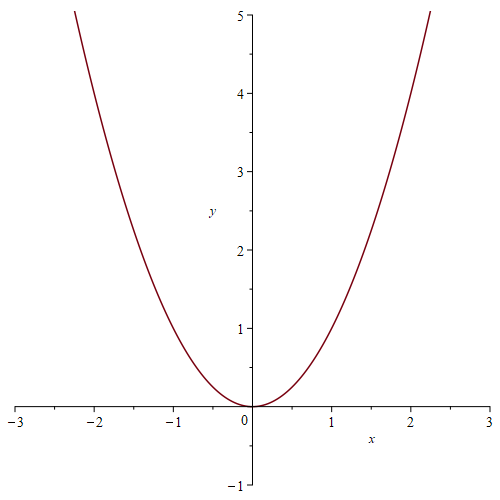
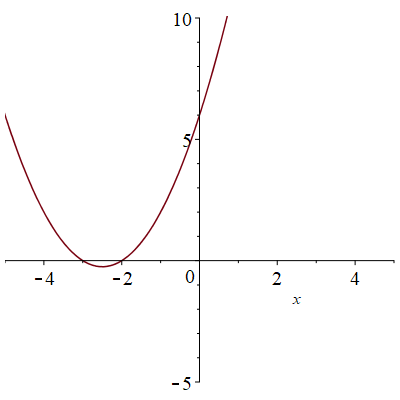
Match each graph below to one of following equations:
a) [latex]y=x^{2}[/latex]
b) [latex]y=(x+2)(x-3)[/latex]
c) [latex]y=2x(x+4)[/latex]
d) [latex]y=x(4-x)[/latex]
e) [latex]y=x(x-4)[/latex]
f) [latex]y=x(x+4)[/latex]
g) [latex]y=(x+3)(x+2)[/latex]
h) [latex]y=(x+3)(x-3)[/latex]
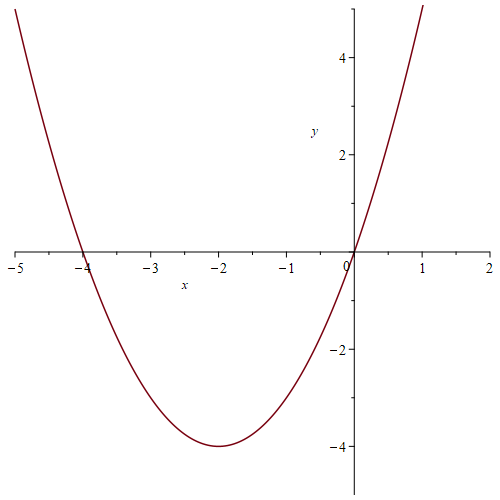
Max or min point (aka vertex):
Max or min point (aka vertex):
Max or min point (aka vertex):
Max or min point (aka vertex):
Explain (in general) how you can determine the x-intercepts from the equation.
What other features of the graph can be determined by the equation? Explain.
In general, if (r, 0) is an x-intercept of a quadratic function then (x – r) is a factor of the quadratic.
In summary, if [latex]r_{1}[/latex] and [latex]r_{2}[/latex] are x-intercepts of a parabola then the equation may be written as [latex]y=a(x-r_{1})(x-r_{2})[/latex]. Furthermore, if we have another point on the parabola, we may plug that point in to determine the value of leading coefficient a.
Review material at Section 6.1: Factors and x-Intercepts as needed.
Example 5.2.4
Consider all rectangles with perimeter 12. We develop a quadratic relationship between the base x and the area y as follows.
a) Draw all possible rectangles with perimeter 12 with whole number dimensions.
b) Fill in the areas in the table below.
| Base (x) | 0 | 1 | 2 | 3 | 4 | 5 | 6 |
|---|---|---|---|---|---|---|---|
| Area (y) | 0 | 0 |
c) Sketch and connect the points
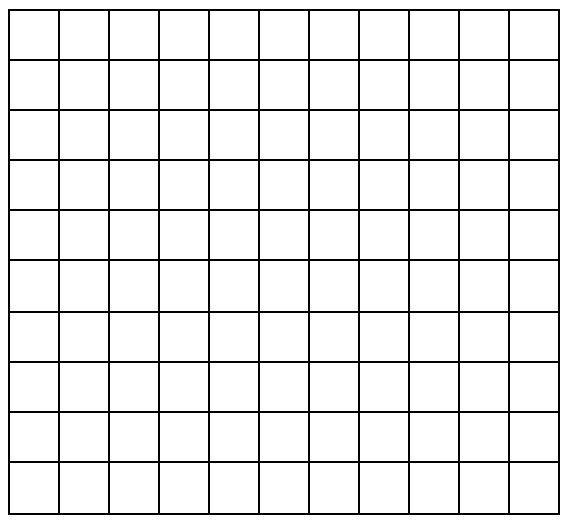
d) Write an equation that expresses the base x as a function of the area y.
e) What is the independent variable? What is the dependent variable? Also state what each of these variables represent in terms of the rectangles.
f) What is the domain (including all points on the graph)? What is the range (including all points on the graph)?
g) For what x-values is the function increasing? For what x-values is the function decreasing? What does this tell us about rectangles with perimeter 12?
h) What is the highest point on the graph and what does it tell us about rectangles with perimeter 12?
Example 5.2.5
The following table represents a quadratic function. Use the information in the table to answer the questions below.
| x | -7 | -6 | -5 | -4 | -3 | -2 | -1 | 0 | 1 | 2 | 3 | 4 |
|---|---|---|---|---|---|---|---|---|---|---|---|---|
| y | -54 | -24 | 0 | 18 | 30 | 36 | 36 | 30 | 18 | 0 | -24 | -54 |
a) What are the x-intercepts?
b) What is the line/axis of symmetry? Explain how you determined this.
c) Write an equation for this quadratic function.
d) Does the graph open up or down? Explain how you determined this.
e) What is the vertex? Explain how you determined this.
Example 5.2.6
The table below represents a quadratic function. Use this information to answer the questions below. Do not sketch until you get to part (e).
| x | -5 | -4 | -3 | -2 | -1 | 0 | 1 | 2 | 3 | 4 |
|---|---|---|---|---|---|---|---|---|---|---|
| y | -175 | -120 | -75 | -40 | -15 | 0 | 5 | 0 | -15 | -40 |
a) What are the x-intercepts?
b) What is the axis of symmetry? Explain.
c) What is the vertex? Explain.
d) Does the graph open up or down? Explain.
e) Sketch the graph and find the equation.
Concavity of Quadratics
Recall the table from the previous example
| x | -5 | -4 | -3 | -2 | -1 | 0 | 1 | 2 | 3 | 4 |
|---|---|---|---|---|---|---|---|---|---|---|
| y | -175 | -120 | -75 | -40 | -15 | 0 | 5 | 0 | -15 | -40 |

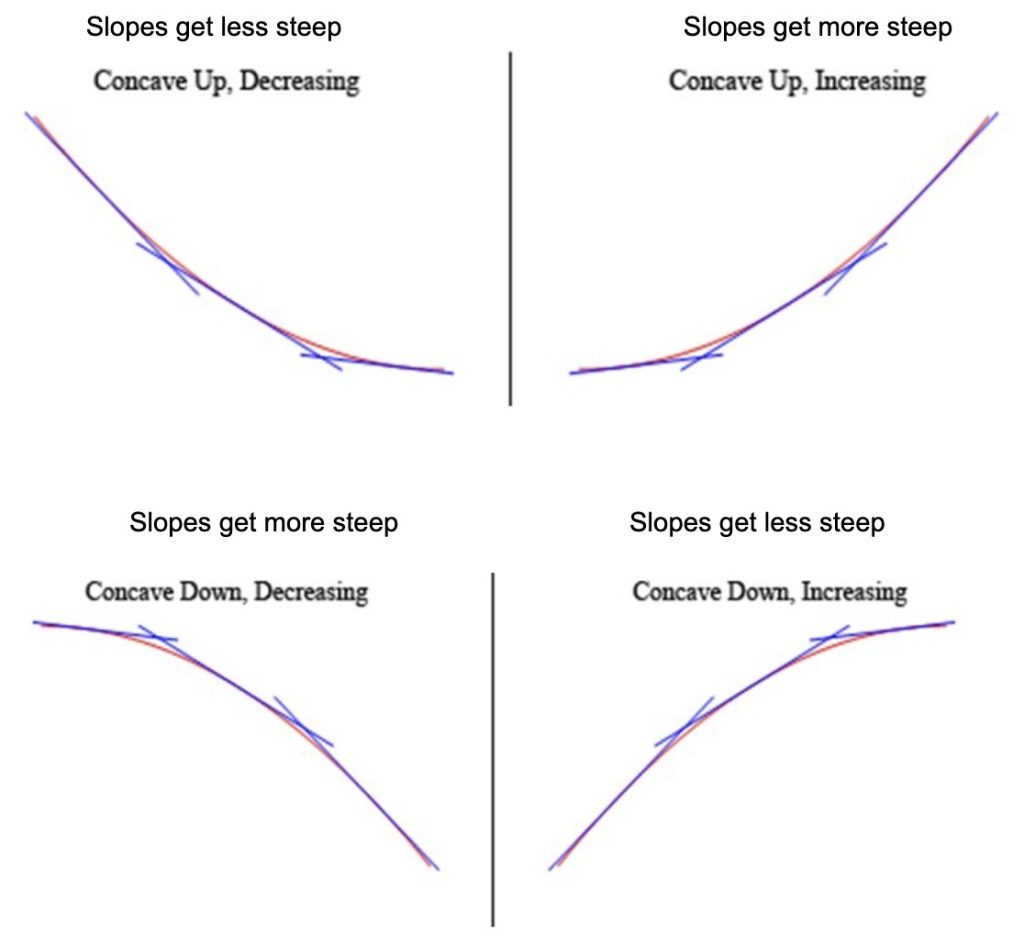
Observe that before the vertex the y-values are increasing by less each time. After the vertex, the y-values are decreasing by more each time (as we go from left to right). This change in the rate of increase or decrease of the y-values is what gives the parabola its curved shape (also known as “concavity” which we discussed in chapter 3). With linear functions, the y-values increase or decrease by the same amount for each x-value increment (constant slope) but with parabolas, the slope (rate of increase/decrease) changes. In general (looking from left to right)
Take another look at the table from the previous example. Do you notice anything else special about how the y-values are changing? Write what you see below.
| x | -5 | -4 | -3 | -2 | -1 | 0 | 1 | 2 | 3 | 4 |
|---|---|---|---|---|---|---|---|---|---|---|
| y | -175 | -120 | -75 | -40 | -15 | 0 | 5 | 0 | -15 | -40 |

Example 5.2.7
Consider the parabola below.
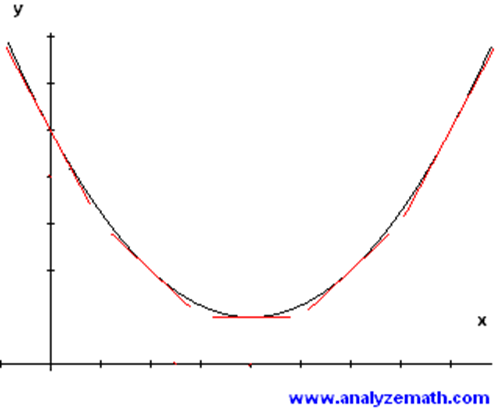
a) Explain what is happening with the slopes (as we move from left to right).
b) What does this say about how and where the function is increasing/decreasing?
Example 5.2.8
Find the equation of the quadratic function represented in the table below using the form [latex]y=ax^{2}+bx+c[/latex] as follows. First, use the y-intercept to find c. Then, plug in two different points to get two equations with unknowns a and b. Solve this system of equations as you learned in chapter 4 (using elimination or substitution).
| x | -5 | -4 | -3 | -2 | -1 | 0 | 1 | 2 | 3 |
|---|---|---|---|---|---|---|---|---|---|
| y | 49 | 25 | 9 | 1 | 1 | 9 | 25 | 49 | 81 |
Example 5.2.9
Find the equation of the quadratic function represented in the table below using the form [latex]y=a(x-h)^{2}+k[/latex] as follows. Find the vertex (h,k) in the table. Then plug in another point to find a.
| x | -5 | -4 | -3 | -2 | -1 | 0 | 1 | 2 | 3 |
|---|---|---|---|---|---|---|---|---|---|
| y | 33 | 22 | 13 | 6 | 1 | -2 | -3 | -2 | 1 |
Example 5.2.10
Consider the parabola below.
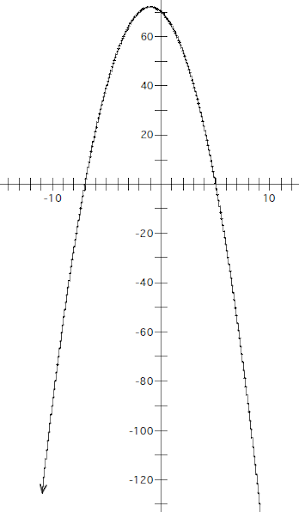
a) What are the x-intercepts? Mark them on the graph.
b) What is the line of symmetry? Sketch it with a dotted line on the graph.
c) What is the vertex? Mark it on the graph.
d) What is the equation for the function? Show your work.
Example 5.2.11
Sketch the graph of the quadratic function [latex]y=x^{2}-2x-8[/latex]. Find and show x and y intercepts and vertex.
Example 5.2.12
Huang is shooting a basketball. The path of the ball is parabolic in shape. The ball reaches a maximum height of 11.5 feet when it is 10 feet from where Huang is standing. The basketball net/hoop is 10 feet high and the ball hits it.
a) Find an equation for the height of the ball as a function of its horizontal distance from Huang. First draw a picture of the ball path.
b) Use your answer to part (a) to determine Huang’s horizontal distance from the hoop.
a statement (with an equal sign) asserting that two expressions have the same numerical value
A function that may be expressed in the form [latex]y=ax^{2}+bx+c[/latex] where a, b and c are constants and a is not equal to zero. The graph of a quadratic function is a parabola.
The vertex of a quadratic function is the lowest point on the corresponding graph if the parabola opens up and the highest point on the graph if the parabola opens down.
The axis or line of symmetry of a quadratic function is the vertical line that goes through the vertex of the corresponding parabola.
The graph of a quadratic equation which is a u-shaped curve that is symmetric about the axis of symmetry.
See https://www.math.net/parabola for a more precise definition.
The y-intercept of function is the point at which the graph of the function intersects the y-axis (where x = 0).
The x-intercept of function is the point at which the graph of the function intersects the x-axis (where y = 0).
The variable that represents input values in a function.
The variable that represents output values in a function.
a letter that represents a quantity that may vary
The set of all input/independent variable values of a relation or function.
The set of all output/dependent variable values of a relation or function.
A function is increasing when the output (y) values are increasing as the input (x) values increase. Graphically, this is when the graph is going up from left to right.
A function is decreasing when the output (y) values are decreasing as the input (x) values increase. Graphically, this is when the graph is going down from left to right.

