3.1 Introduction to Functions
We begin by revisiting a problem from the chapter on patterns to see how growing patterns can be expressed as a relationship between two quantities.
3.1 Examples
Example 3.1.1
Recall the pattern below from the “Growing Patterns” section

We found the number of tiles in the nth figure to be 1 + 3(n - 1) = 3n - 2. This explicit formula gives us a relationship between the figure number n and the number of tiles required for that figure. We can represent this relationship in many different ways as follows:
Words: The number of tiles in the nth figure is 3n - 2 for n = 1, 2, 3, …. (and so on)
Equation: T = 3n - 2 where n is the figure number and T represents the number of tiles in figure n. This gives us a rule of how to find an output value T that corresponds to an input value n.
Table: The first column shows input values and the second column shows the corresponding output values.
| Figure number (n) (input) | number of tiles (T) (output) |
| 1 | 1 |
| 2 | 4 |
| 3 | 7 |
| 4 | 10 |
| n | 3n - 2 |
Set of ordered pairs/points: [latex]\left\{ \left( 1,1 \right), \left( 2,4 \right),\left( 3,7 \right),\left( 4,10 \right),...,\left( n,3n-2 \right),... \right\}[/latex]
The first number in each pair gives an input value (figure number) and the second number in each pair gives the corresponding output value (number of tiles in the corresponding figure). Each pair in the set is of the form (input, output).
The braces { } notation on the outside is commonly used to enclose a set.
In this case it is a set of points or ordered pairs.
Graph: Plot points on the axes below.
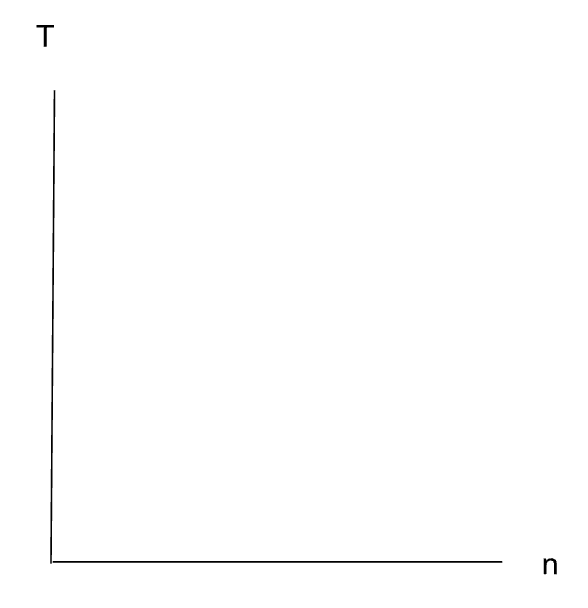
The relationship described in example 3.1.1 between the figure numbers and the number of tiles required for each figure is a function (more details later) and functions are specific types of so called relations so we will define relations first.
Relations
A relation is a relationship between two sets of objects/numbers in which objects from one set (of inputs) are paired with objects from the other set (of outputs). The domain of a relation is the set of all input and the range of a relation is the set of all outputs.
Example 3.1.1 gives a relation between the figure number and the number of tiles required for that figure.
Example 3.1.2
What is the domain and range of our relationship from Example 3.1.1?
When studying these concepts in terms of the xy-plane (Cartesian Coordinate system), the variable x is often used to represent input (values along the horizontal axis) and y is often used to represent output (values along the vertical axis).
In particular, in Example 3.1.1, if we use x in place of n and y in place of T, the equation [latex]T = 3n - 2[/latex] becomes [latex]y = 3x - 2[/latex]. Observe this is a linear relationship (the graph forms a line - if we connect the points). In the next chapter we will study linear functions in depth.
This connection enables us to see the importance of studying patterns in elementary and middle school and its relationship to the study of functions in high school. When you teach your future students about patterns, you will be giving them the preparation to study functions which is the foundation of mathematical modeling!
Input/output tables are used in elementary and middle school to give students an understanding of the relationship between two variables.
Input/output video with single operations:
Video with single operations multiplication and division only:
Example 3.1.3
For each table below, guess the rule, that is, determine what is being done to the input x to get the output y? Then write a corresponding equation with x and y for each table.
a)
| Input (x) | Output (y) |
| -3 | 9 |
| -2 | 4 |
| -1 | 1 |
| 0 | 0 |
| 1 | 1 |
| 2 | 4 |
| 3 | 9 |
b)
| Input (x) | Output (y) |
| -3 | 9 |
| -2 | 6 |
| -1 | 3 |
| 0 | 0 |
| 1 | -3 |
| 2 | -6 |
| 3 | -9 |
c)
| Input (x) | Output (y) |
| -3 | -7 |
| -2 | -5 |
| -1 | -3 |
| 0 | -1 |
| 1 | 1 |
| 2 | 3 |
| 3 | 5 |
d) Now make up your own “guess the rule” problem. Then swap with a classmate to find an equation for each other’s rule(s).
Formal Definition of a Function
A function is a relation between two sets, the domain (set/list of all input values) and range (set/list of all output values), such that each input value (in the domain) is matched to EXACTLY ONE output value (in the range).
If the input variable is x and the output variable is y, then we say, “y is a function of x”.
Formally, we call the input variable the independent variable and the output variable the dependent variable (discuss why this makes sense).
Functions are powerful models for many real-life phenomena. If we can look at something that naturally has a relationship in which there is only one 𝑦 for each 𝑥, then we might be able to capture that functional relationship algebraically (by this we mean with a formula) and then we can study the phenomenon by studying the algebraic model for the relationship.
Illustration
If we think of input (x) as a vending machine code and output (y) as the item that we get out of the machine then we consider this a function since each code should give us EXACTLY ONE item. Discuss this in terms of the image shown.

What is the domain of this (vending machine) function? Record your answer below.
What is the range of this (vending machine) function? Record your answer below.
Can you think of how a different vending machine may NOT be a function? That is, how one code might give you two different items? Discuss.
The vending machine example provides a good introduction to the idea of a function. Now we will address examples with numbers as the input and output.
A good place to start with determining whether a (numerical) relationship is a function or not is with so called “arrow” or “mapping” diagrams that give a more visual representation.
The following video addresses such diagrams and domain and range of the corresponding functions:
Watch this “function or not” video for examples with other representations (graph, table, points and mapping diagrams):
Example 3.1.4
Determine whether the following relationships represent functions or not and justify your answer. Also state the domain and range of each.
a) 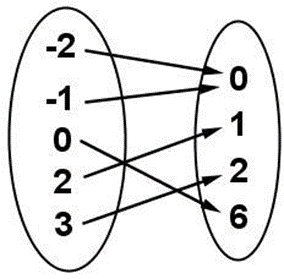
b) 
c)
| x (input) | -3 | -2 | -1 | 0 | 1 | 2 | 3 |
|---|---|---|---|---|---|---|---|
| y (output) | 9 | 4 | 1 | 0 | 1 | 4 | 9 |
d)
| x (input) | 3 | 2 | 1 | 0 | 1 | 2 | 3 |
|---|---|---|---|---|---|---|---|
| y (output) | -9 | -4 | -1 | 0 | 1 | 4 | 9 |
Example 3.1.5
Use the Vertical Line Test to determine whether the following graphs express y as a function of x or not and justify your answer. Also state the domain and range of each.
Images from p.50 in OER http://www.lulu.com/shop/carl-stitz-and-jeff-zeager/functions-fitchburg-state-2017/paperback/product-23311630.html
a) 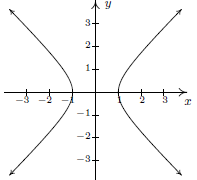
b) 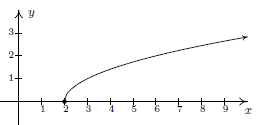
c) 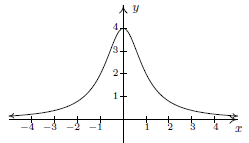
d) 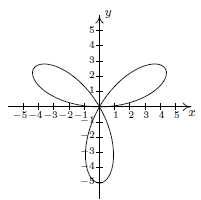
e) State the Vertical Line Test in your own words and explain why it works.
Summary
If each input value matches to EXACTLY ONE output value then the relationship IS a function. If there is an input value that matches to MORE THAN ONE output value then the relationship is NOT a function.
So far each representation has its own “test” for determining whether it is a function or NOT.
Mapping/Arrow diagrams: NOT a function if one input points to two or more outputs
Tables: NOT a function if any x-values repeat (assuming distinct y-values)
Graphs: NOT a function if a vertical line intersects the graph more than once
When it comes to equations….
If we can solve for y and get a single expression in terms of x ONLY then it IS a function.
If we cannot solve for y or if we try to solve for y and get more than one expression, then it is NOT a function.
Watch the following video for an example of an equation that does NOT represent y as a function of x
You can visit Khan Academy's page for discussion and more
Example 3.1.6
Determine whether the following equations express y as a function of x or not and justify your answer.
a) [latex]\left| x \right|+y=5[/latex]
b) [latex]x^{2}-4y^{2}=1[/latex]
c) [latex]y=\sqrt{x-2}[/latex]
d) [latex]x=\left| y-2 \right|[/latex]
Finally we look at relationships expressed in words and determine if they are functions or not.
The vending machine illustration showed us such an example of a functional relationship between the input code and the output product.
Watch the following video for an example of a relationship that is NOT a function:
You can visit Khan Academy's page for discussion and more
Example 3.1.7
a) A teacher has his 25 students call off numbers 1, 2, 3, 4, 5 to put his class into 5 groups. Is the relationship between the student (input) and their group number (output) a function or not? Explain your answer.
b) A teacher has her students build as many rectangles as they can with 12 square tiles. Is the relationship between the area (input) of these rectangles and the perimeter (output) of these rectangles a function or not? Explain your answer.
Example 3.1.8
a) Describe a relationship in words that is a function. Identify your input and output.
b) Describe a relationship in words that is NOT a function. Identify your input and output.
A relationship between a set of input values and a set of output values, such that each input value is matched to EXACTLY ONE output value.
A relationship between two sets of objects/numbers in which objects from one set (of inputs) are paired with objects from the other set (of outputs).
The set of all input/independent variable values of a relation or function.
The set of all output/dependent variable values of a relation or function.
a letter that represents a quantity that may vary
The variable that represents input values in a function.
The variable that represents output values in a function.

