3.2 Average Rate of Change
In this section we look at how the output changes as we change the input of a function. This is something we have already observed in many examples (e.g. how the figure grows as the figure number increases). Now we formalize the concept. Let us first look at a specific example.
3.2 Examples
Example 3.2.1
Consider the table below that gives the number of push-ups, P, Kenya has completed as a function of time t in seconds.
| Time in seconds (input t) | 0 | 10 | 20 | 30 | 40 | 50 |
|---|---|---|---|---|---|---|
| Total number of push ups (output P) | 0 | 5 | 25 | 50 | 64 | 70 |
a) Graph the data below.

b) By how much is the number of push-ups increasing per second on average from 10 seconds to 50 seconds? We figure this out by taking the total change in the number of push-ups during this time period and dividing by the total change in time. Show your work below.
c) What does the answer to part (b) tell us about the number of push-ups Kenya did? Explain in your own words.
We call the answer to Example 3.2.1 (b) the average rate of change of the number of push-ups from 10 to 50 seconds.
In general, the average rate of change of an output quantity on a given input interval is the change in the output divided by the change in the input on that interval. That is, the change in the dependent (output) variable divided by the change in the independent (input) variable.
This means the amount the output changes (on average) for each unit increase in the input (e.g. number of push ups per second)
In Example 3.2.1 we looked at [latex]\frac{\textit{change in P}}{\textit{change in t}}[/latex].
This formula should look somewhat familiar as the formula for SLOPE.
In particular, the slope of the line through the points [latex]\left( x_{1},y_{1} \right)[/latex] and [latex]\left( x_{2},y_{2} \right)[/latex] is [latex]\frac{y_{2}-y_{1}}{x_{2}-x_{1}}[/latex] or [latex]\frac{y_{1}-y_{2}}{x_{1}-x_{2}}[/latex].
So the average rate of change of the number of push-ups from 10 to 50 seconds is equal to the slope of the line through the points (10, 5) and (50, 70).
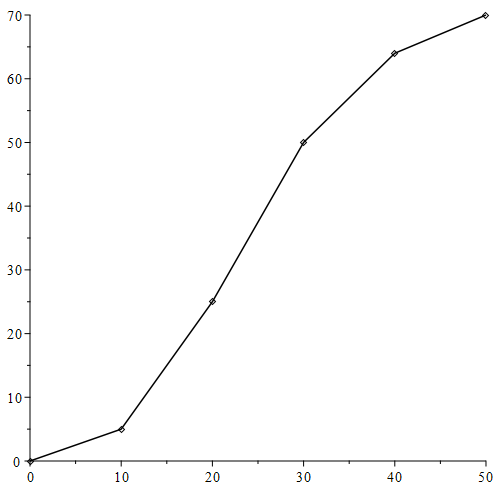
Below is a sketch of the graph of P as a function of t with points connected by line segments.
Draw the line through points (10, 5) and (50, 70) and specify the slope of this line based on your answer in Example 3.2.1

Example 3.2.2
Reconsider the push up data copied below.
| Time in seconds (input t) | 0 | 10 | 20 | 30 | 40 | 50 |
|---|---|---|---|---|---|---|
| Total number of push ups (output P) | 0 | 5 | 25 | 50 | 64 | 70 |
a) What is the average rate of change of the total number of push-ups from 0 to 30 seconds?
b) What does the answer to part (a) tell us about the number of push-ups Kenya did?
c) Show (and explain) on the graph below what your answer to (a) means in terms of slope.

Function Notation
Read and work through the corresponding “checkpoint” exercises at Subsection: Function Notation
Below we use function notation to define average rate of change (that is, slope)
The average rate of change of a function f(x) from x = a to x = b is
[latex]\frac{f(b)-f(a)}{b-a}[/latex]
Observe that this is the slope of the line through the points (a, f(a)) and (b, f(b)).
This is the same average rate of change formula as before but stated using function notation.
Example 3.2.3
Find the average rate of change of [latex]f(x)=3x^{2}+2x-7[/latex] from [latex]x = -4[/latex] to [latex]x = 2[/latex].
Example 3.2.4
Let [latex]C(x)=x^{2}-10x+27[/latex] represent the cost, in hundreds of dollars, to produce x thousand pens. Find the average rate of change of cost as production increases from making 3000 to 5000 pens. Then explain what the answer tells us about pen production.
Supplemental material
Supplemental Material Section 1.4: Slope and Rate of Change
Connecting Functions to Sequences: Section 9.1: Sequences . Read and work through the corresponding “checkpoint” exercises.
A relationship between a set of input values and a set of output values, such that each input value is matched to EXACTLY ONE output value.
The average rate of change of a function from one input value to another input value is calculated the same as the slope and it is a measure of how much the function changes per input unit, on average, between the given input values.
a letter that represents a quantity that may vary
The slope of a function from one input value to another input value is the change in corresponding output values divided by the change in the given input values (often known as the change in y divided by the change in x or "rise over run"). Graphically, the slope gives the steepness of the line through the two corresponding points.
An ordered list of objects (e.g., numbers) usually with a certain pattern.

