3.2 Exercises
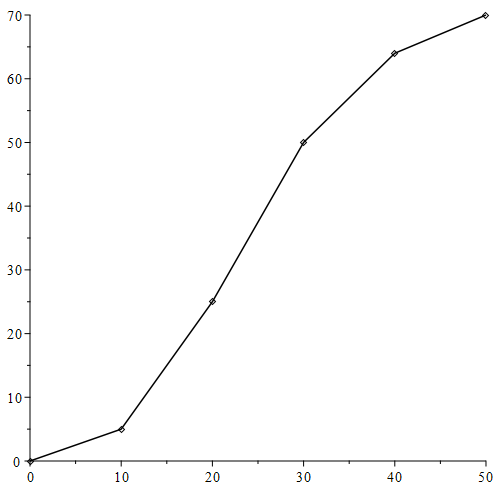
1) Reconsider the push up data copied below.
| Time in seconds (input t) | 0 | 10 | 20 | 30 | 40 | 50 |
|---|---|---|---|---|---|---|
| Total number of push ups (output P) | 0 | 5 | 25 | 50 | 64 | 70 |
a. What is the average rate of change of the total number of push-ups from 20 to 40 seconds?
b. What does the answer to part (a) tell us about the number of push-ups?
c. Show (and explain) on the graph below what your answer to (a) means in terms of slope.

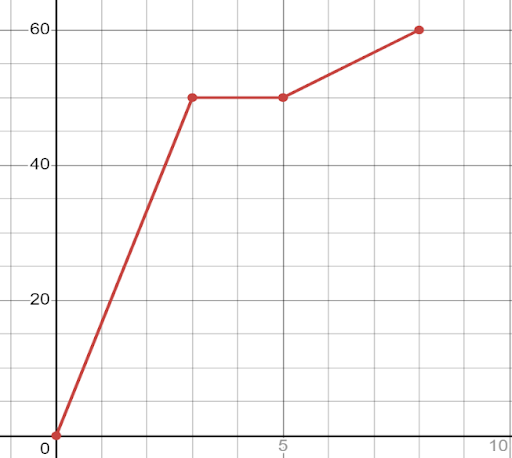
2) Consider the graph below representing the number of customers served at a Chick-fil-A as a function of time in hours.

a. Find the average rate of change from 0 to 3 and explain what information this gives you about the customers.
b. Find the average rate of change from 0 to 7.5 and explain what information this gives you about the customers.
c. What do you think the horizontal line segment signifies?
3) The height H, of an object dropped from the roof of an eight story building is given by the following equation [latex]H=-16t^{2}+64[/latex] where H is the height of the object in feet, t seconds after it is dropped. Find the average rate of change of H from 0 to 2 seconds and explain what it tells us about the height of the object.
4) The temperature F in degrees Fahrenheit t hours after 6 AM is given by the following equation [latex]F(t)=-\frac{1}{2}t^{2}+8t+32[/latex].
a. Find the average rate of change of F from [latex]t = 4[/latex] to [latex]t = 8[/latex] and explain what it tells us about the temperature.
b. Find the average rate of change of F from [latex]t = 8[/latex] to [latex]t = 12[/latex] and explain what it tells us about the temperature.
c. Find the average rate of change of the temperature between 10 AM and 6 PM.
The average rate of change of a function from one input value to another input value is calculated the same as the slope and it is a measure of how much the function changes per input unit, on average, between the given input values.
The slope of a function from one input value to another input value is the change in corresponding output values divided by the change in the given input values (often known as the change in y divided by the change in x or "rise over run"). Graphically, the slope gives the steepness of the line through the two corresponding points.
A relationship between a set of input values and a set of output values, such that each input value is matched to EXACTLY ONE output value.

