3.3 Exercises
1) Erin walks from her home to a convenience store, where she buys some cat food, and then walks back home. Sketch a possible graph of her distance from home as a function of time.
2) While bicycling from home to school, Greg gets a flat tire. He repairs the tire in just a few minutes but decides to backtrack a few miles to a service station, where he cleans up. Finally, he bicycles the rest of the way to school. Graph the distance between Greg and his home as a function of time, from the moment he leaves home until he arrives at school.
3) Sketch a possible graph of the height of your head above the ground during a ride on a Ferris wheel as a function of time. Show at least two full rotations.
4) After you leave your math class, you start off toward your music class. Halfway there you meet an old friend, so you stop and chat for a while. Then, you continue to the music class. Graph the distance between you and your math classroom as a function of time, from the moment you leave the math classroom until you reach the music classroom.
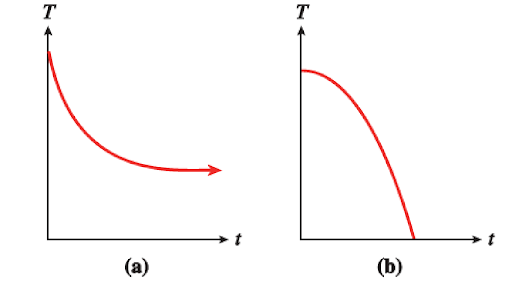
5) Francine bought a cup of cocoa at the cafeteria. The cocoa cooled off rapidly at first, and then gradually approached room temperature. Which graph below, (a) or (b), more accurately reflects the temperature of the cocoa as a function of time?

Select statements below that justify your answer by circling all that apply.
a) The graph has a steep negative slope at first, corresponding to an initial rapid drop in the temperature of the cocoa.
b) The graph becomes closer to a horizontal line, corresponding to the cocoa approaching room temperature.
c) The graph has a slight negative slope at first, corresponding to an initial rapid drop in the temperature of the cocoa.
d) The graph becomes steeper and steeper, corresponding to the cocoa approaching room temperature.
Is the graph you chose concave up or concave down?
6) Match each graph below with one of the scenarios that follow. Write a 1-2 sentences for each scenario explaining why you chose the graph you did.


- Kelly and Cindy sprinted from one end of the gym to the other end. They then jogged back to where they started. Cindy sprinted faster than Kelly.
- John walked to school. The second half of his walk was uphill, so he walked at a slower pace.
- Rachel drove to the dentist’s office. Her appointment lasted for 45 minutes, and then she headed home.
- Mike and Ron rode their bikes from Middletown to Centerville and back. Soon after they began, Mike was always ahead of Ron.
7) Match each situation below with graph I, II, III or IV.
a) Unemployment was falling but is now steady.
b) Inflation, which rose slowly until last month, is now rising rapidly.
c) The birthrate rose steadily until 1990 but is now beginning to fall.
d) The price of gasoline has fallen steadily over the past few months.

A relationship between a set of input values and a set of output values, such that each input value is matched to EXACTLY ONE output value.
The slope of a function from one input value to another input value is the change in corresponding output values divided by the change in the given input values (often known as the change in y divided by the change in x or "rise over run"). Graphically, the slope gives the steepness of the line through the two corresponding points.
A function is concave up where its graph lies above its tangent lines. This occurs when the output (y) values are either increasing at an increasing rate as input (x) values increase or output (y) values are decreasing at a decreasing rate as input (x) values increase. This gives the graph a bowl or half bowl like shape.
A function is concave down where its graph lies below its tangent lines. This occurs when the output (y) values are either increasing at an decreasing rate as input (x) values increase or output (y) values are decreasing at an increasing rate as input (x) values increase. This gives the graph an upside-down bowl or half bowl like shape.

