6.1 Data Samples
The idea of data sampling is surprisingly complex but groundwork for it can be laid in elementary school. The NCTM Standards advocates that students in grades 3-5 should…
“…begin to understand that many data sets are samples of larger populations. They can look at several samples drawn from the same population, such as different classrooms in their school, or compare statistics about their own sample to known parameters for a larger population… they can think about the issues that affect the representativeness of a sample – how well it represents the population from which it is drawn – and begin to notice how samples from the population can vary (p. 181).”
We will address some of the terminology in this quote later when we get into sampling but first we briefly address data types. Broadly speaking, there are two types of data:
numerical and categorical
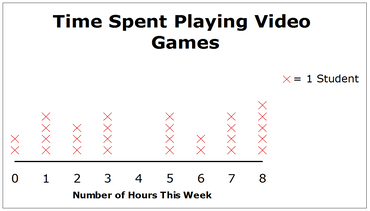
Numerical data (also known as quantitative data): Data as a measurement, such as a person’s height or weight. Such data may also be a count, such as the number of cookies a person ate or hours spent on video games (line plot illustration below).

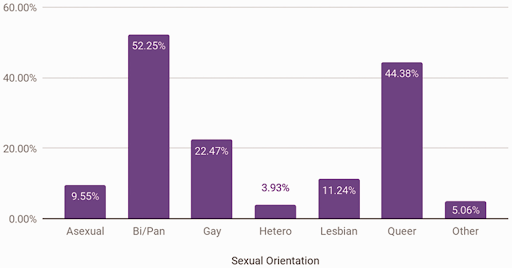
Categorical data (also known as qualitative data): Data as a characteristic such as a person’s hair color, hometown, types of movies they like or sexual orientation (bar graph illustration below).

No matter what the data type, it is always important to consider how the data were selected. We illustrate this with the following activity.
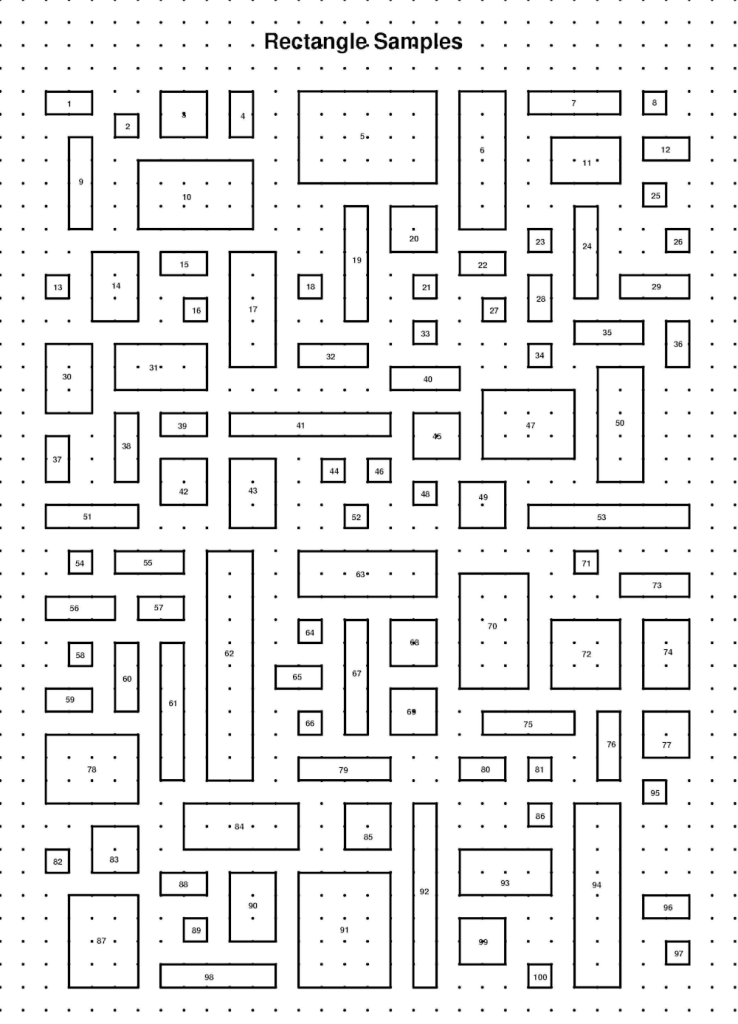
Activity: Consider the population of 100 rectangles on the next page. Notice that each one has an area (a size). For example, rectangle number 74 has size 6 square units because it is composed of 6 small squares.
1) Each student carefully select a sample of ten rectangles that they think will have an average size close to the average size of all 100 rectangles on the page. Find the average size of your self-selected ten. Record the areas of your chosen rectangles and the average area below. Then, as a class, record averages on the board as follows: make a number line on the board that shows each distinct average in numerical order. (Each student) Put an x above your average number. We call this a line plot of the data.
2) Each student selects 10 rectangles at random. This will be done as follows: Your instructor will have a bowl with each of the 100 rectangle areas written on its own piece of paper and each student will have a turn to pick 10 pieces of paper at random. After each student picks and records their numbers, they will put them back into the bowl and the teacher will mix up the papers before the next student picks their 10. Write your 10 areas below and calculate the average area of these. Then, as a class, make a line plot of everyone’s averages on the board.
3) Estimate the average size of all 100 rectangles, based on the line plots on the board. Write your answer below and explain why you chose the number you did.
4) As a class, calculate the actual average area of all 100 rectangles by splitting up the numbers to add into groups (e.g. 10 groups of 10 rectangles for 10 students to add up areas) and then adding up all of your subtotals and finally dividing by 100. Record the result below. Discuss how close or far this number is from your estimates in #1, 2 and 3.

This rectangle size problem contains a big lesson in statistics: Humans are not always good at selecting samples. If you want unbiased information, it is best to choose samples at random. In order to talk more about this, we need to discuss the language behind the sampling of data.
A population is the entire group that the collected data are intended to describe.
A sample is a subset of the population from which data are collected.
A parameter is a value calculated using all the data from the population. Parameters represent a property of the population (e.g. average height).
A statistic is a value calculated using data from a sample. Statistics represent a property of the sample (e.g. average height).
The sampling rate is calculated as follows: [(# in the sample) ÷ (# in the population)]
This number is often multiplied by 100 to get a percent.
6.1 Examples
Example 6.1.1
In our rectangle problem, the population was the set of all 100 rectangles and we took samples of size 10.
a) What is the sampling rate?
b) What is the parameter average?
c) What is the statistic average from your random sample?
Example 6.1.2
According to Data USA, in 2021, of the 13,348 full time students enrolled at the Fitchburg State University, there were 1280 African Americans, 1386 Hispanics or Latinos and 406 Asians. If you were to take a random sample of 500 students from that population, approximately how many of each ethnic group would you expect to find in your sample?
Hint: First, find what percent of the population each ethnic group is.
African Americans:
Hispanics:
Latinos:
Asians:
A sample is biased if members of the population do not have equal likelihood of being in the sample.
For example if we wanted to gather data on weights of students at a particular school, the following would be considered biased samples.
- Students in a particular class
- Students in a particular grade
Discuss why data from these samples may be biased.
Can you think of other samples that might be biased?
Types of Bias
Sampling bias: when the sample is not representative of the population
Voluntary response bias: the sampling bias that often occurs when the sample is volunteers
Self-interest bias: bias that can occur when the researchers and/or participants have an interest in the outcome
Response bias: when the responder gives inaccurate responses for any reason
Perceived lack of anonymity: when the responder fears giving an honest answer might negatively affect them
Loaded question bias: when the question wording influences the responses
Non-response bias: when people refusing to participate in the study can influence the validity of the outcome
Example 6.1.3
If we picked a sample at random from all the students at a school then this would be an unbiased sample of students at that particular school. This is what we refer to as simple random sampling – like picking names out of a hat.
There is another type of random sampling called cluster (random) sampling where we break up the population into groups/clusters and randomly select a certain number from each group. For example if we randomly choose 20 students from each grade at the school to collect weight data.
Yet another type of sampling is called systematic sampling in which researchers choose members of the population at regular intervals. For example, if we pick every 10th person in a population of 100 then this would be considered a systematic random sampling. Sources vary on whether or not systematic sampling is considered random. What do you think? Discuss
The point of a statistical study is to use a sample to learn about a population by computing statistics which approximate the population’s true parameters. However, even a good representative sample will only approximate the population’s actual parameters.
Sampling error is based on the difference between the parameter and the statistic. We will not formally define it in this class, but understanding the idea provides a good start for elementary school students to appreciate its importance. In practice, we often do not know what the sampling error is because we don’t have the means to gather information about the entire population in order to find parameters (hence the point of sampling). However, it makes sense that in order to reduce sampling error we should make our sample random and big enough.
So, what is “big enough”?
It seems like you would need some significant sampling rate (like, maybe 25% of the population), but it turns out that good surveys can be done with quite small samples. For example, national polling to predict the outcome of the presidential election is often done with only a few thousand people. That’s a few thousand out of more than 100 million likely voters (0.003% of the population). The sampling rate can be so small because people are not all that diverse from a sampling perspective.
Think of it this way: suppose you are going to sample a big pot of soup to see how it tastes. As long as that soup is stirred up really well, and the chunks of meat and vegetables in there aren’t too big or too different, all you need is a small bite to know the flavor.
The response rate of a survey is the number of responses divided by the number in the sample (multiply by 100 to get it as a percent).
Example 6.1.4
In order to study how satisfied the 41,732 citizens of Fitchburg, MA are with snow removal from city streets, I conducted the following study. I stood in front of Market Basket on a Monday morning in February from 9:00am until noon and I asked every third person who walked in whether they were satisfied with snow removal from streets in Fitchburg. One hundred and eight people said they were satisfied. Twenty-five people said they were not, and 18 refused to answer my question.
a) What is the sampling rate?
b) What is the response rate?
c) What type of bias’ may be present in this study. You may list more than one. Explain each choice.
Example 6.1.5
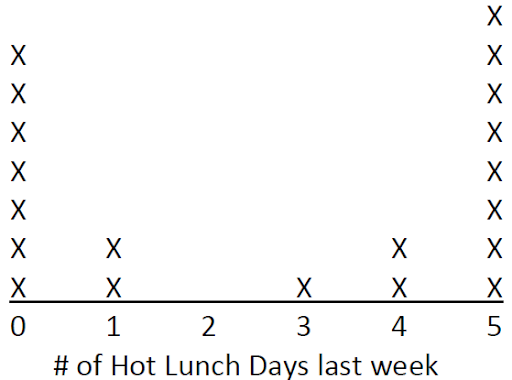
Suppose your third graders have collected data from their class on the number of times last week that they ate hot lunch at school and displayed it in the following so called line plot (each x represents 1 child in the class):

There are many questions you might ask your students about these data – but there are some questions particularly related to sampling that should be asked and discussed.
Read each question and respond to the prompts that follow.
Question 1: Was there anything special about last week that might have made these data different than if we’d asked the same question next week or do you think last week was a typical week?
Prompt 1: In what ways might your students respond to this question? What points about sampling could you make in each case?
Question 2: How do you think the data might have been different if we’d asked the fifth graders the same question?
Prompt 2: In what ways might they respond to that question? What points about sampling could you make in each case?
Questions 3: Would it be okay to label this graph “Number of Days Each Week that Children Eat Hot Lunch at Our School?” Why or why not?
Prompt 3: In what ways might they respond to that question? What points about sampling could you make in each case?
Notice that these questions help children think about whether the data is representative of a population larger than the sample of 20 third-graders shown on the graph, and it helps them to begin to think critically about what the data says and what it does not say.
Example 6.1.6
Consider the following claim from a company that produces a certain weight loss supplement:
“Four out of five TikTok influencers recommended this weight loss supplement for people who are overweight”
Think of some questions you could ask about the corresponding data behind this claim. Discuss.
Surveys and data can be misleading. It is important for you and your students to think critically about information based on survey data. In particular, you should consider the following:
- Sampling method: Surveys are meant to provide information about a population, but a survey is only as accurate as its sample in representing that population.
- Any method other than random sampling is likely to produce a biased sample. This includes approaches that systematically remove parts of the population or those that force diversity or intentionally change the representation of socially identified groups. Such approaches create samples that may misrepresent the population, affecting the usefulness & generalizability of any data collection and analysis that follows from it.
- A random sample will tend to be representative of the population. If a population is diverse, a random sample will tend to pick up that diversity in its appropriate amounts, provided that it is not too strongly affected by a low response rate or self-selection bias.
- Wording of Questions: Questions used by questionnaires or interviews should use neutral language and be carefully worded to avoid being misinterpreted, misleading, or otherwise influencing the responses. Also, depending on the question being asked, self-reported data might have inaccuracies that could be avoided.
- Analysis: The information we get from reliable data from a representative sample depends upon the values we choose to calculate. In the next section, we discuss measures of central tendency (for example: average) and what they tell us (or do not tell us) about our data.
- Presentation: Results from studies are often presented with explanations and graphs. There are many ways to present data and some of these can be misleading or inaccurate. Later in this chapter we will look at different types of graphs and learn how to read and critique them.
Done carefully, statistical studies can give us an accurate picture of a population and its characteristics. Statistics can be very helpful in making important predictions and in advising change. For example, statistics are used to make weather forecasts, to advise health and security measures. Statistics may also be used to help second grade teachers understand their students’ issues and interests.
As teachers you may gather data for your students to analyze from the U.S. Census Bureau website and other sources. For example check out the the following data on bullying from the National Center for Education Statistics https://nces.ed.gov/fastfacts/display.asp?id=719
Data as a numerical measurement.
A pictorial representation of data which tallies up the frequency of each distinct data value using x's or some other symbol. These are also referred to as line plots or dot plots. Note the frequency of a value is the number of times it appears in the data.
Data that describes qualities or characteristics that cannot be numerically measured.
The entire group that the collected data are intended to describe.
A subset of the population from which data are collected.
A value calculated using all the data from the population.
A value calculated using data from a sample.
Sampling rate equals
(size of the sample) ÷ (size of the population).
This number is often multiplied by 100 to get a percent.
A sample is biased if members of the population do not have equal likelihood of being in the sample.
Types of bias include:
Sampling bias: when the sample is not representative of the population
Voluntary response bias: the sampling bias that often occurs when the sample is volunteers
Self-interest bias: bias that can occur when the researchers and/or participants have an interest in the outcome
Response bias: when the responder gives inaccurate responses for any reason
Perceived lack of anonymity: when the responder fears giving an honest answer might negatively affect them
Loaded question bias: when the question wording influences the responses
Non-response bias: when people refusing to participate in the study can influence the validity of the outcome
Selecting data points randomly from a population, like picking names out of a hat.
A method of selecting samples that breaks up the population into groups/clusters and randomly select a certain number from each group.
A method of selecting samples in which researchers choose members of the population at regular intervals.
The number of responses divided by the number in the sample (multiply by 100 to get it as a percent).

