6.3 Exercises
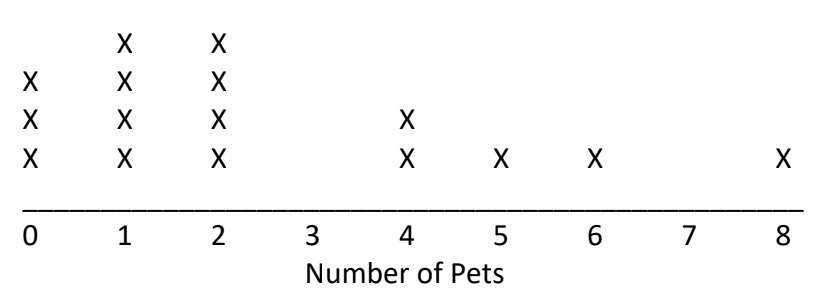
1) Below is a line/frequency plot showing the number of pets in 16 households. Find the mean number of pets per household. Show your work.

2) Consider the frequency plot below of 18 scores on a quiz.

a) Find the mean
b) Find the median score and explain your process below, as you would to a student.
c) Why does it make sense that the mean is smaller than the median for these data? Explain below.
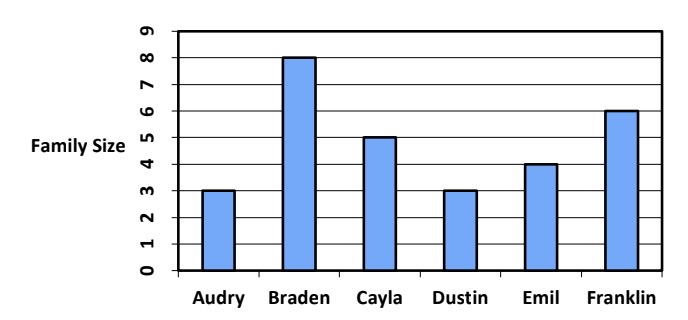
3) Consider the following graph of the number of people in 6 families.

Figure out how you can use the graph to find the mean family size, without doing any calculations (hint: use redistribution). Explain how you did it.
4) Ten kids were served cookies and they were eaten as follows: Three kids ate 1 cookie each, two kids ate 2 cookies each, two kids ate 3 cookies each, two kids ate 5 cookies each and one kid ate 7 cookies.
a) Sketch the data on a line/frequency plot
b) Find the mean number of cookies eaten (per kid).
5) Here is a data set of the number of years members of the math department have been employed at a school: 7, 25, 7, 15, 8, 23, 27, 6, 1, 3, 28, 22, 24, 9, 15, 14, 18, 8. Compute the mean, median and mode for these data. Show your work.
Mean:
Median:
Mode:
6) Decide whether each of the following is True or False. Explain your answers.
a) If ten people took an exam, then it is possible that all but one of them scored less than the mean.
b) If ten people took an exam, then it is possible that all but one of them scored less than the median.
c) If ten people took a 100-point exam, it is possible that the mean and median are 90 points apart.
7) At a job fair, representatives from three different departments approached you, trying to recruit you to their program. When asked how much their graduates make, here were their responses:
- Representative 1: Ten people graduated recently with our degree and their mean annual income is $75,000.
- Representative 2: Ten people graduated recently with our degree and their median annual income is $75,000.
- Representative 3: We have recently graduated one hundred people and their mean annual income is $75,000.
Which program would you be most inclined to choose, if money were your only concern? Which would least interest you? Explain.
8) Go to the following link: https://www.statcrunch.com/applets/type1&meanmedian. Read the instructions. Do the “Try” activities (copied below) and put your answers to the corresponding prompts below.
a) Create a set of values very close together. Then add a value far away from this set. What’s the impact of the far away value on the mean and the median?
b) Create a data set with a median below 2 and a mean between 2 and 4. Copy our data set below.
c) Specify a sample size and then select Simulate to generate a variety of data sets. Make observations about the mean and median in relation to your simulations and record your observations below.
9) Ann needs a mean of 80 on her five exams in order to earn a B in her class. Her exam scores so far are 78, 90, 64 and 83. What does she need to get on her fifth exam to earn the B?
10) Results for a 20-point multiple choice math quiz are as follows: 9 students scored a 20, 4 students scored 19, 3 students scored 18, 5 students scored 17, and 1 student scored 12. Figure out the class average in two ways as follows:
a) Using weighted average
b) Not using weighted average (just using regular average/mean)
11) Watch the video on how to calculate college GPA (grade point average) for a particular semester. Pause the video as prompted (at approximately 3:45 time) to try the example before viewing the solution. Then check your GPA for last semester and show your work below.
12) Barack is in a math class where quizzes are worth 15% of the grade, exam 1 and exam 2 are worth 20% each, and the final exam is worth 25% of the final grade. Given his grades below, compute the following.
| Q1 | Q2 | Q3 | Q4 | Q5 | hw1 | hw2 | hw3 | hw4 | exam1 | exam2 | Final exam | |
| score | 5 | 6 | 8 | 8 | 9 | 10 | 10 | 0 | 8 | 41 | 48 | 89 |
|---|---|---|---|---|---|---|---|---|---|---|---|---|
| out of | 9 | 9 | 9 | 9 | 9 | 10 | 10 | 10 | 10 | 53 | 56 | 92 |
a) Barack’s final average as a percent.
b) Barack’s final average as a percent if the zero on HW 3 is dropped.
13) Assume you are in a class where quizzes are 20% of your grade, homework is 20%, exam 1 and exam 2 are 15% each, and the final exam is 30%. Suppose it is week 5 and you want to calculate your current average. The grades you have so far are as follows:
First three quizzes: 6/9, 8/10, 9/9
First three homework assignments: 9/11, 10/10, 4.5/7
Exam 1: 58/63
What is your current average in the course?
Extra Practice with Mean and Weighted Average (worksheet)
A pictorial representation of data which tallies up the frequency of each distinct data value using x's or some other symbol. These are also referred to as line plots or dot plots. Note the frequency of a value is the number of times it appears in the data.
The mean of a set of data is the average of all the values. That is, the mean is computed by summing the values and dividing by the number of values in the data set.
The median of a set of data is the middle value (assuming the data is in order). If there are two middle values, the median is the average of the two middle values.
An average where each number has a different level of importance/weight.

