6.3 Measures of Central Tendency
There are three statistics that are commonly used to describe the center of a distribution of numerical data: mean, median and mode.
The mean of a set of data is the average of all the values. That is, the mean is computed by summing the values and dividing by the number of values in the data set.
The median of a set of data is the middle value (assuming the data is in numerical order). If there are two middle values, the median is the average of the two middle values.
The mode is the most frequently appearing number among the data values. There may be more than one mode.
First we focus on mean, and later we will address median and mode.
Children in grades 3-5 can easily understand and compute median and mode, but typically the idea of mean is a more difficult topic. This is not because it is hard to calculate a mean but rather because it is more difficult to understand the idea of a mean.
Before showing elementary school students the standard computation of the mean, teachers should help them understand the concept which can be done by addressing the mean as a redistribution process or as finding the balance point.
The redistribution concept of the mean: The mean value of a set of numbers is what each data point would get if the data was redistributed so that each data point had the same amount.
This concept is essentially the same as the partitive concept of division: taking a total amount and sharing it equally into a number of groups, and seeing how much each group gets.
Another way to look at mean as redistribution is “evening off” the data. That is, the mean is the value each person would get if all the data was shared evenly.
For example, suppose the picture below shows the cookies that belong to each child.
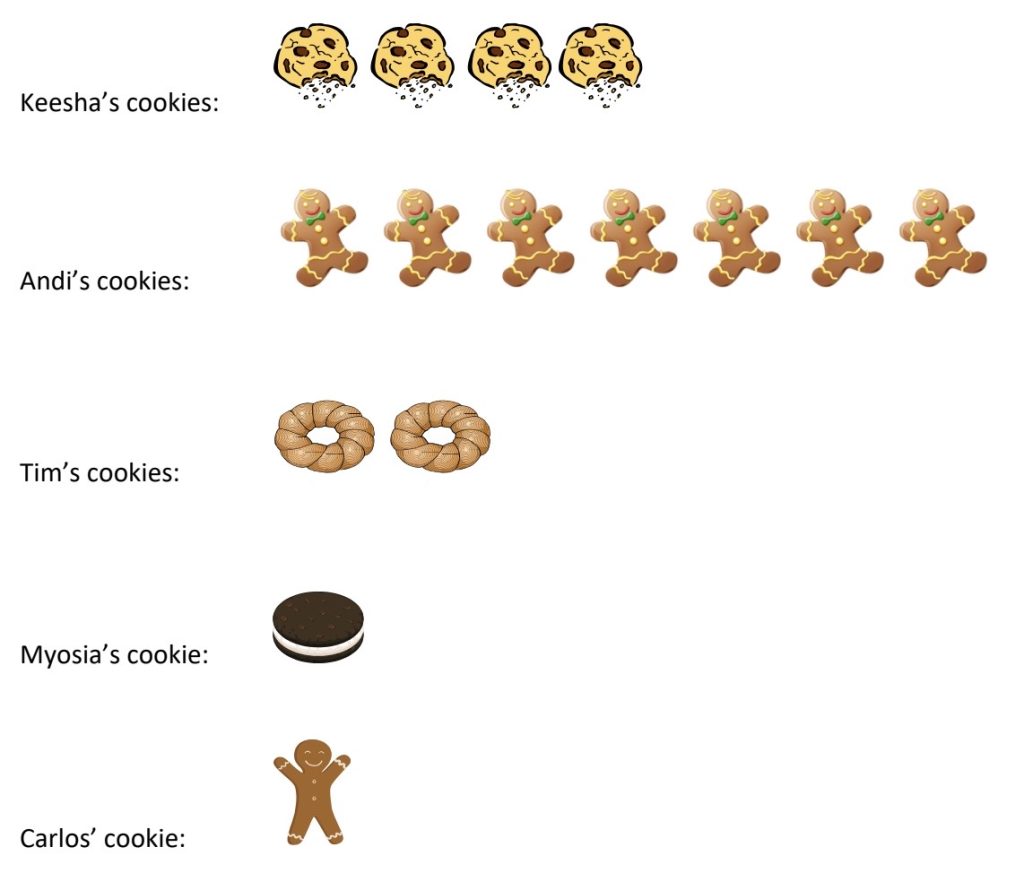
In order to find the mean number of cookies, the children could imagine sharing cookies (or even parts of cookies) so that each child has exactly the same number of cookies as follows.
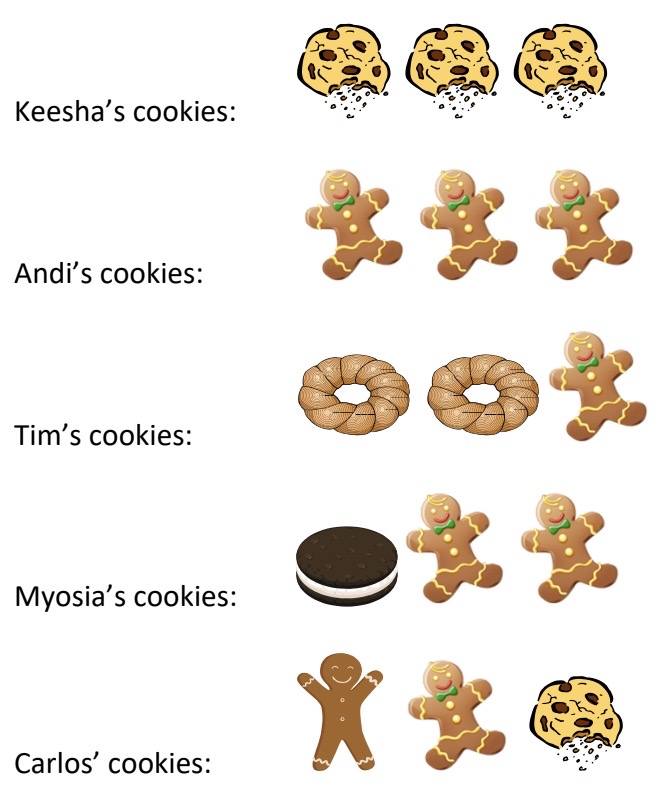
So, the children see that the mean number of cookies is 3. In this case we didn’t need to break up cookies into pieces (fractions of a cookie) in order to share them, but you should have such examples in your future classes.
Class Activity
a) Each person in the class write his/her/their first name on sticky notes so that there is one letter on each sticky note. For example someone with the first name “JEN” would need 3 sticky notes to write the letters J, E and N on each one respectively. Line the sticky notes up on the board in vertical stacks/piles as illustrated below.
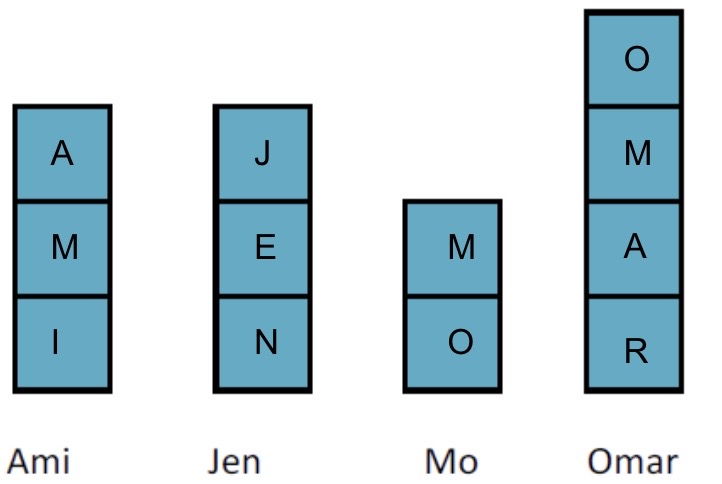
Proceed as follows to find the mean/average number of letters in first names in the class: Rearrange the sticky notes so that every stack/pile ends up with the same number of letters/sticky notes or equal parts of sticky notes. Use scissors to cut sticky notes in parts as needed to get the piles exactly equal in height.
Write the mean you found below.
b) Now organize the first name data in another way as follows: Each person gets ONE sticky note, writes their entire first name on it, and places it on a so-called “bar graph” on the board, based on the number of letters in your first name. For example, if your first name is “JEN” then you would place your sticky note above the number 3. For clarification, an illustration is shown below for names Mo (2 letters), Ami (3 letters), Jen (3 letters), Omar (4 letters), Karen (5 letters), Skyla (5 letters), Jethro (6 letters) and Juanita (7 letters).
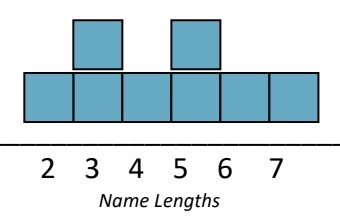
Once all the sticky notes are on the board, use the bar graph data to help calculate the mean name length for the class. Show your work below.
6.3 Examples
Example 6.3.1
The family sizes for children in a class are shown below. Make a bar graph for these data and then find the mean number of family members.
| Family | Size |
| Jenson | 8 |
| Lewis | 3 |
| McDuff | 7 |
| Earles | 4 |
| Seaman | 5 |
| Ortiz | 4 |
| Peters | 6 |
| Todd | 5 |
| Miene | 3 |
Explain how you could use the redistribution concept of the mean to solve this problem. Show and explain your process below.
The balance point concept of the mean (click the triangle/arrow to expand):
Viewing our data values as equal weights placed on a ruler or number line level in a location that corresponds to their value, the balance point would be where we have to put a pivot in order for the level to balance. The image below illustrates some trial and error in finding the mean (as a balance point) of the data set 1, 2, 6, 7, 9.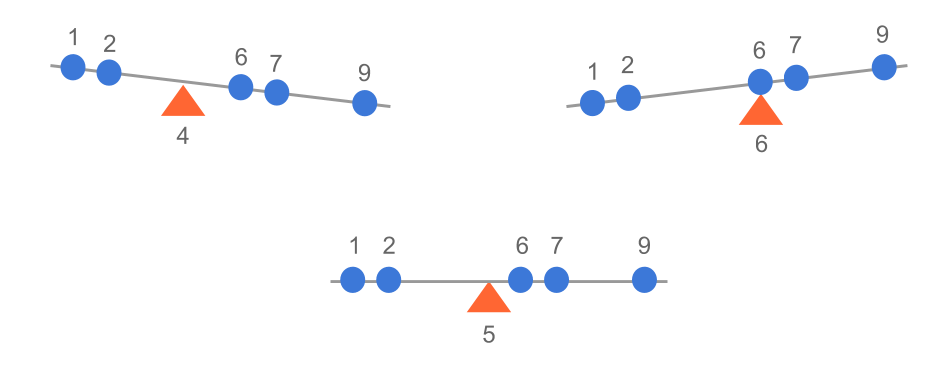
Pre-Class Work: How to find mean as a balance point
- Read and work through examples in the following lesson: mean as the balancing point
- Watch the following videos:
Balance point concept of the mean
Was there anything unclear in the presenter’s words? Be prepared to discuss.
Balance point missing value
Explain below in your own words how distances relate to the mean of a data set.
Let us revisit the cookie example. Recall the number of cookies for each student gives us the following numbers: 4, 7, 2, 1, 1. Use the method shown in the (balance point) videos to find the mean. Show your work below.
Now check if the following equality (as claimed in the second video) holds for the cookie data:
Sum of the distances from each data point to the left of the mean, to the mean value
EQUALS
Sum of the distances from each data point to the right of the mean, to the mean value
Show your work below.
Question: In what type of scenario would the line/frequency plot technique used in the pre-class work videos NOT work to find the mean? Discuss.
Example 6.3.2
Suppose there are 4 cats with a mean weight of 10 pounds. You know the weights of 3 of the cats. Those weights are: 4 pounds, 7 pounds, and 15 pounds.
a) Use the equality below to find the weight of the 4th cat.
Sum of the distances from each data point to the left of the mean, to the mean value
EQUALS
Sum of the distances from each data point to the right of the mean, to the mean value
Show your work below.
b) Check your answer for part (a) by finding the average weight of all 4 cats. That is, by adding all the weights and dividing by 4.
As illustrated by the previous examples, the balance point concept of the mean views the mean as the value such that the sum of the distances that each data point is above this value balances with the sum of the distances that each data point is below this value.
Now let us try to solve some slightly more advanced mean problems using arithmetic and/or algebra.
Example 6.3.3
You have taken four math quizzes. Your scores were 82, 67, 85, and 72. What do you need to score on the 5th quiz for your average quiz score to be 75? One way to solve this problem is to let a variable represent the number you are looking for, set up an equality with this variable using the definition of the mean and solve the equation. However, feel free to use another method.
Example 6.3.4
Last semester I had two sections of Math 1600 that took an exam. Section 1 had 25 students, and the mean score was 65 points. Section 2 had 15 students and the mean score was 75 points. Determine the mean score over all 40 students.
So far we have been dealing with mainly whole number data values. It is important in the elementary classroom to include activities with fractions as well to keep students comfortable and confident with all types of numbers.
Homework/Classwork Activity
Before class:
- Watch the following video which illustrates mean in an application involving fractions
- Make up your own such problem (involving mean and fractional data). Write it on a piece of paper
During class:
- Swap problems with a classmate and solve each other’s problems (show all work).
- Swap back to correct each other’s solutions and give feedback.
Now we address other measures of center (aside from mean): median and mode.
The median of a set of data is the middle value (assuming the data is in numerical order). If there are two middle values then we average these two to get the median of the data set.
Once again let us recall the cookie problem: The number of cookies held by the five people is 4, 7, 2, 1, and 1. If we put these values in numerical order, we get: 1, 1, 2, 4, 7
We see that the middle value is 2 (we’ll write M = 2.).
Why should we put them in numerical order first? How would you explain this to a child?
In the case of an even number of values, for example 1, 1, 2, 3, 4, 7, we have no single middle value, and so the median is the average of the two middle values 2 and 3. That is, the median of this data is 2.5.
The mode is the most frequently appearing number among the data values. There may be several modes in a single data set if there are values with the same maximum frequency.
What is the mode for the cookie data? 1, 1, 2, 4, 7
Example 6.3.5
Find the mean, mode, and median of bowling scores below:
112 114 120 123 127 127 130 167 220
Mean:
Median:
Mode:
Why does it make sense that the mean is larger than the median for these data? Explain.
Example 6.3.6
A data set consists of 10 whole numbers. The median is 4 and the mean is 5. What are the largest and smallest possible values for the maximum? Hint: Think of the numbers in ascending order so the maximum number is last, then determine what the mean and median tell us about the data. Don’t be afraid of some trial and error. Show your work below.
a) Largest maximum value:
b) Smallest maximum value:
Class Activity: Go to https://digitalfirst.bfwpub.com/stats_applet/stats_applet_6_meanmed.html
Read how the app works and play around with it to get a better understanding.
Then, proceed as follows: Create three data sets, all of which have 6 data points and a mean and median of approximately 50 that meet the following criteria. For each set, make a sketch of the corresponding number line with your data points below. The data point values are not labeled in the app so just do the best you can with approximating where the points should be based on the criteria
- Set A: Every data point is between 35 and 65.
- Set B: Every data point is either less than 25 or greater than 75.
- Set C: The difference between every pair of two consecutive data points is the same.
Respond to the following prompts based on your exploration with the Mean and Median app.
1) Discuss the similarities and differences between the data sets. Record notes below.
2) Are there other data sets with 6 points, a mean of 50, and a median of 50 that look different from the three you’ve created? If so, give an example below.
3) What did you learn about mean and median by doing the exploration provided using the applet?
4) How might these ideas help students understand how the mean and median relate to a distribution of data?
It is important to know which measure of central tendency (mean, median, or mode) is “better” to use in a given situation. This depends on which type of questions you are considering. The mode, for instance, can be used for categorical data, but the mean and the median do not make sense in that context. Why?
If you wanted to know how much money you would make working at Microsoft Corporation, would it be more honest to look at the mean income of its employees, or the median income? Explain.
Now we address a concept that is closely related to the mean and important for any teacher to understand.
Weighted average
When all the grades in a class are weighted equally, in order to get the final average we simply add up all the grades and divide by the number of grades, that is we find the mean or average of all the grades. However, more often than not, some grades are weighted differently (that is worth more or less) than other grades in the class. In this case we need the concept of weighted average to calculate overall averages.
Weighted averages are also used in many other applications related to data analytics, finance, and more.
Pre-Class Work (weighted average)
1) Watch the following videos to learn about weighted average.
How to calculate grades using weighted average
2) Explain below in your own words how to calculate weighted averages.
In summary, the weighted average of a set of values is obtained as follows:
- Multiply each value in the set by its corresponding weight (in decimal form)
- Add up the products from step (1)
- Divide the sum from step (2) by the sum of all weights (in decimal form).
Class Activity (in class in groups): Complete the following exercises related to weighted averages
1) A certain Algebra I class has weighted grades. The weights are:
10% Homework
30% Quizzes
60% Tests
A grade sheet is given below. Calculate the student’s current average based on these grades.
| Assignment | Grade |
| HW 1 | 100 |
| HW 2 | 100 |
| HW 3 | 105 |
| HW 4 | 96 |
| HW 5 | 97 |
| HW 6 | 100 |
| Quiz 1 | 68 |
| Quiz 2 | 84 |
| Test 1 | 78 |
Important Note: In terms of grading, if all grades are in and a final average is being calculated then the sum of all weights (in decimal form) should be 1 (corresponding to 100% of the work being considered), as in #1 above. However, there are some situations in which the sum of all the weights is not 1. For example when you want to calculate a student’s average before all the grades are in, at which time only some of the work is being considered. In #2 we see an example of this situation.
2) Lina has the grades below so far in her math class in which homework is worth 30% of the final average, quizzes are worth 30% and midterm and final exams are worth 20% each.
| Assessment | Grade |
| HW 1 | 95% |
| HW 2 | 90% |
| HW 3 | 92% |
| Quiz 1 | 80% |
| Quiz 2 | 70% |
a) Calculate Lina’s current average in the class.
b) Assuming Lina’s homework and quiz averages remain consistent, what will she need to average on her exam scores in order to get an A (90% or higher) in the class?
3) Describe below the difference between “average” and “weighted average” as if you were trying to explain it to an elementary school student.
4) Tabitha ordered dinner for a party of 10 people. Three people ordered the $7.75 chicken dinner, two people ordered the $10.95 fish dinner and five people ordered the $8.75 beef dinner. What was the average cost of each dinner at Tabitha’s party? Calculate this in two ways as follows. Show your work.
a) Using weighted average
b) Not using weighted average (just using regular average/mean)
A value calculated using data from a sample.
Data as a numerical measurement.
The mean of a set of data is the average of all the values. That is, the mean is computed by summing the values and dividing by the number of values in the data set.
The median of a set of data is the middle value (assuming the data is in order). If there are two middle values, the median is the average of the two middle values.
The mode is the most frequently appearing number among the data values. There may be more than one mode
A graphical representation of data in which bars are used show the frequency of the corresponding category (or value) within a set of data. The height of each bar equals the frequency of the corresponding data value.
A pictorial representation of data which tallies up the frequency of each distinct data value using x's or some other symbol. These are also referred to as line plots or dot plots. Note the frequency of a value is the number of times it appears in the data.
Data that describes qualities or characteristics that cannot be numerically measured.
An average where each number has a different level of importance/weight.

