Data and Demographics
Linguistic diversity in schools in the United States is significant and growing. The data reflects a wide array of languages spoken by students and underscores the importance of addressing the needs of children from diverse linguistic backgrounds. Here are some key statistics and insights about linguistic diversity in U.S. schools from the National Center for Education Statistics:
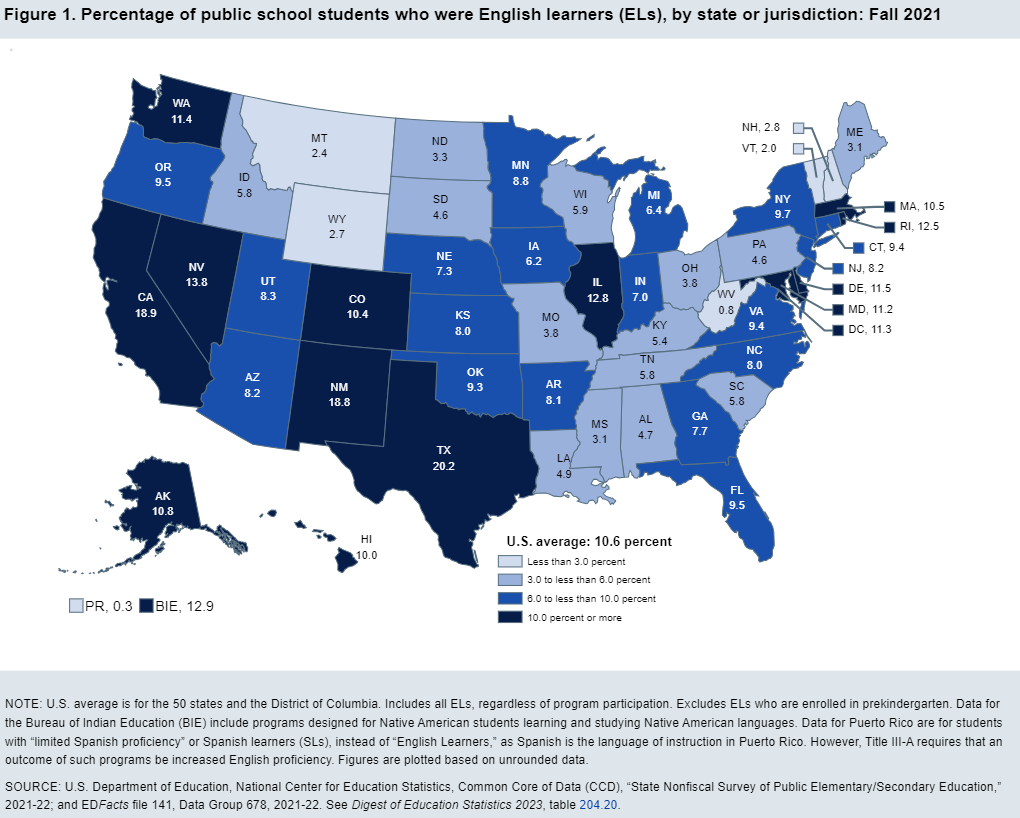
The data table represented in the map is at the end of this chapter.
Pause to Reflect:
- Which three states had the highest percentages of English Learners (ELs) in their public school populations in fall 2021?
- What was the range of percentages for states that identified at least 6.0 but less than 10.0 percent of their students as ELs?
- How did the percentage of ELs in Massachusetts compare to the percentage in West Virginia, and what does this tell you about the regional differences in EL populations?

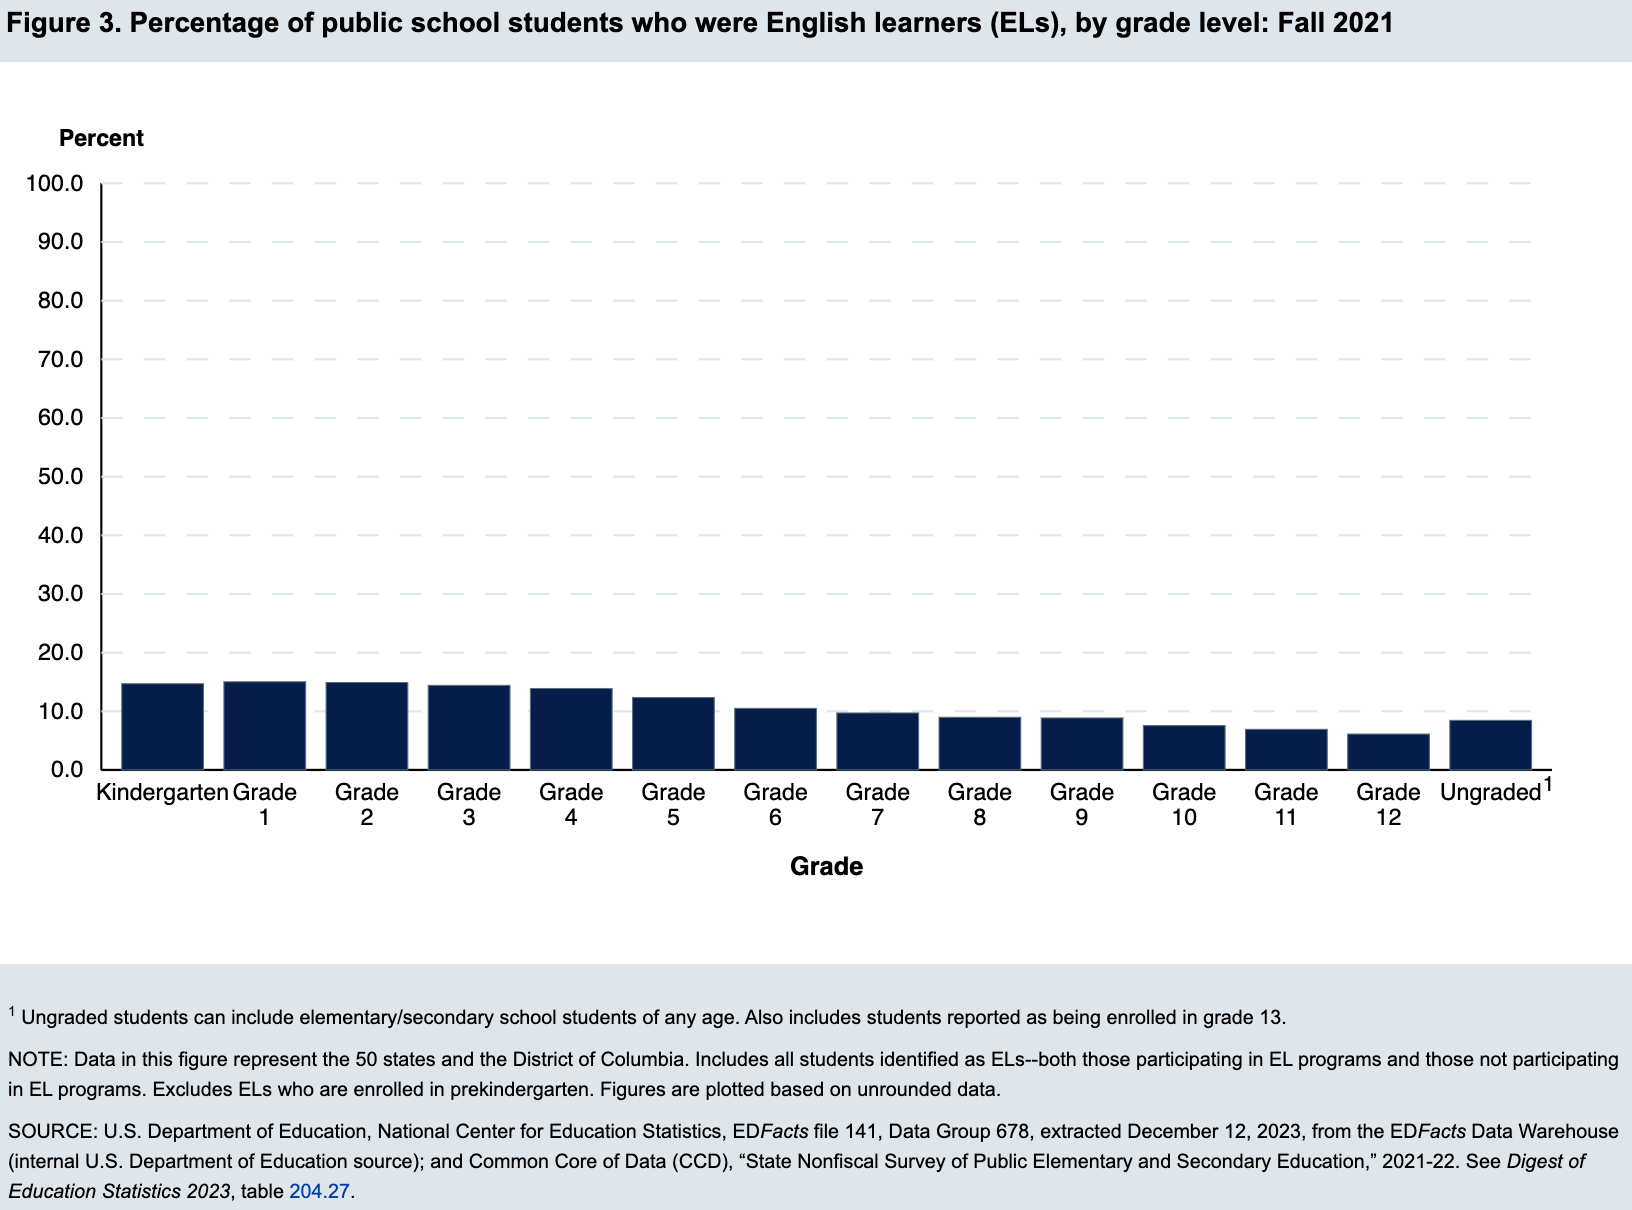
The data table represented in the map is at the end of this chapter.
Pause to Reflect!
- What trend was observed in the percentage of English Learners (ELs) across different grade levels in fall 2021?
- How does this data inform programming and support services for schools and communities?
| Home Language | Number of ELs | Percentage distribution of ELs1 | Number of ELs as a % of total enrollment |
| Spanish, Castilian | 4,023,289 | 76.4 | 8.4 |
| Arabic | 130,917 | 2.5 | 0.3 |
| English2 | 116,771 | 2.2 | 0.2 |
| Chinese | 95,584 | 1.8 | 0.2 |
| Vietnamese | 75,070 | 1.4 | 0.2 |
| Portuguese | 50,205 | 1.0 | 0.1 |
| Russian | 39,403 | 0.7 | 0.1 |
| Haitian, Haitian Creole | 31,122 | 0.6 | 0.1 |
| Hmong | 30,181 | 0.6 | 0.1 |
| Urdu | 26,567 | 0.5 | 0.1 |
1 Detail does not sum to 100 percent because not all home language categories are shown.
2 Examples of situations in which English might be reported as an English learner’s home language include students who live in multilingual households and students adopted from other countries who were raised speaking another language but currently live in households where English is spoken.
NOTE: Data in this table represent the 50 states and the District of Columbia. Includes all students identified as ELs–both those participating in EL programs and those not participating in EL programs. Excludes ELs who are enrolled in prekindergarten.
SOURCE: U.S. Department of Education, National Center for Education Statistics, EDFacts file 141, Data Group 678, 2021-22, extracted December 12, 2023. See Digest of Education Statistics 2023, table 204.27.
Pause to Reflect!
- Which home language was the most commonly reported among EL public school students in fall 2021?
- Which languages do you see represented in your own community and schools?
- Which languages are you familiar with? Unfamiliar with? Where are these languages spoken?
Data table represented on Figure 1’s map and Figure 3’s graph:
| State or jurisdiction | Percentage low to high |
| Less than 3.0 percent | |
| Puerto Rico | 0.272795577 |
| West Virginia | 0.754194365 |
| Vermont | 2.037511164 |
| Montana | 2.376244216 |
| Wyoming | 2.725231757 |
| New Hampshire | 2.836387165 |
| 3.0 to less than 6.0 percent | |
| Mississippi | 3.076244344 |
| Maine | 3.129059262 |
| North Dakota | 3.326088445 |
| Ohio | 3.794163976 |
| Missouri | 3.843172375 |
| Pennsylvania | 4.57892551 |
| South Dakota | 4.627513145 |
| Alabama | 4.672753564 |
| Louisiana | 4.871665769 |
| Kentucky | 5.416063549 |
| Idaho | 5.780918863 |
| Tennesee | 5.798984458 |
| South Carolina | 5.842141794 |
| Wisconsin | 5.944711518 |
| 6.0 to less than 10.0 percent | |
| Iowa | 6.203920017 |
| MI | 6.383767681 |
| IN | 6.96973351 |
| NE | 7.304832033 |
| GA | 7.683147842 |
| NC | 7.965785987 |
| KS | 7.984154059 |
| AR | 8.122108402 |
| NJ | 8.229420256 |
| AZ | 8.239682198 |
| UT | 8.298042939 |
| MN | 8.806831889 |
| OK | 9.294457103 |
| CT | 9.365411929 |
| VA | 9.394750423 |
| FL | 9.513459406 |
| OR | 9.537296881 |
| NY | 9.691425118 |
| 10.0 percent or more | |
| HI | 10.02032591 |
| CO | 10.43689679 |
| MA | 10.54669011 |
| United States AVERAGE | 10.64791982 |
| AK | 10.78695438 |
| Maryland | 11.18211696 |
| Washington, DC | 11.28694831 |
| Washington | 11.44213304 |
| Deleware | 11.53892879 |
| Rhode Island | 12.47708673 |
| Illinois | 12.81890861 |
| Bureau of Indian Edu. | 12.86933481 |
| Nevada | 13.76826782 |
| New Mexico | 18.80265795 |
| California | 18.92036689 |
| Texas | 20.15188778 |
Media Attributions
- Percentage of ELs by state Fall 2021 © Education. U.S. Department of Education, Institute of Education Sciences. Retrieved [date], from https://nces.ed.gov/programs/coe/indicator/cgf. is licensed under a Public Domain license
- Percentage ELL by State © Education. U.S. Department of Education, Institute of Education Sciences. Retrieved 11/5/2024

