Empathy Map
Ireena Haque
Empathy Map
Now that the primary actors have been finalized to be fat patients and family doctors, it is crucial to understand them better on a personal level. The Empathy Map tool was employed for this task.
Empathy Map: Fat Patients
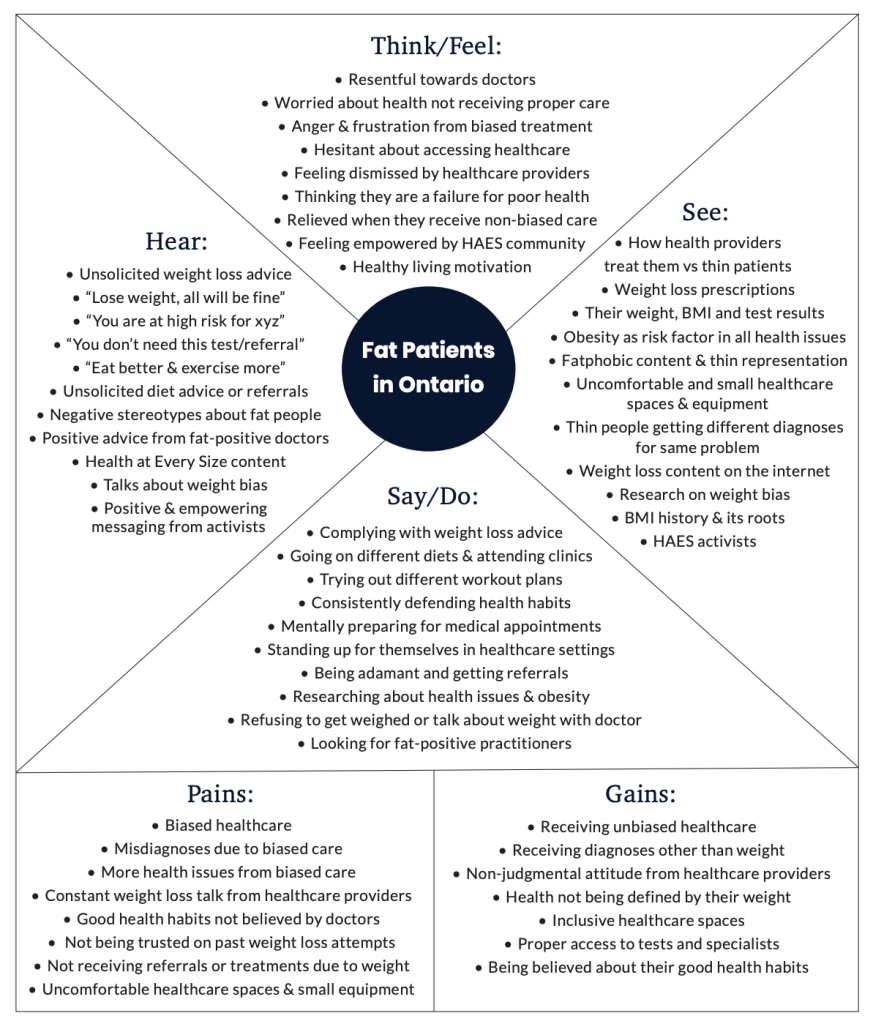
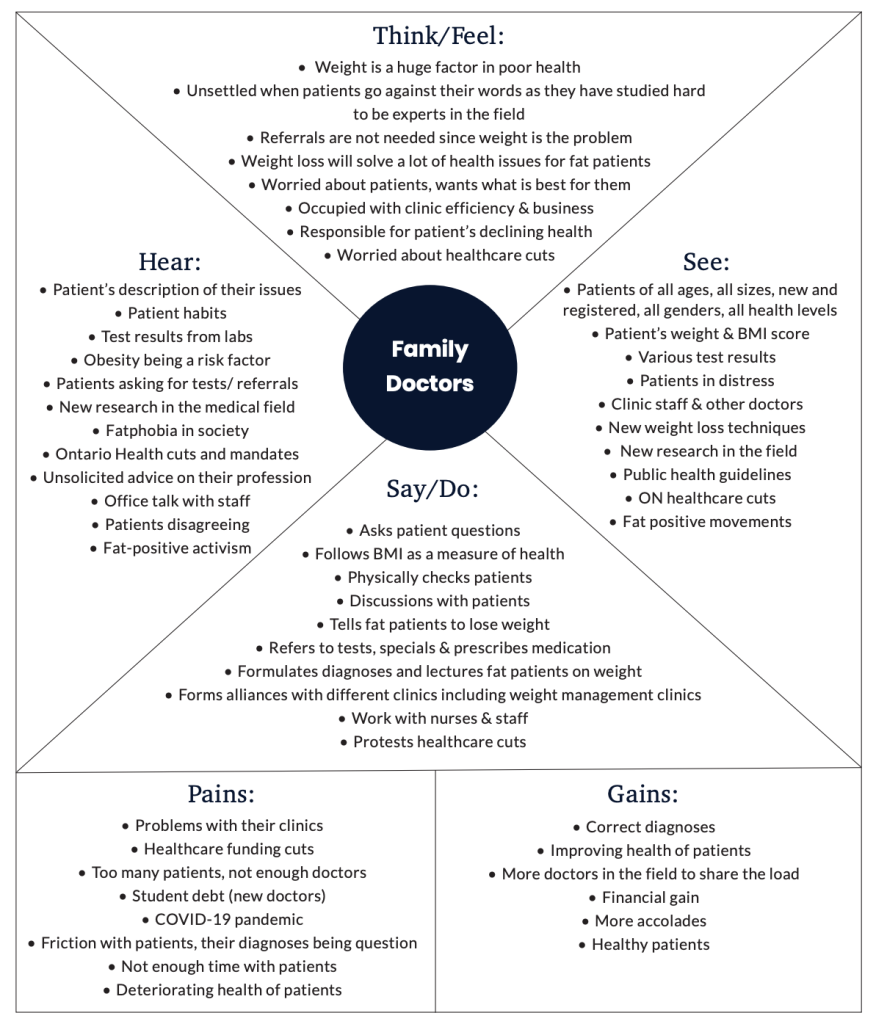
The Empathy Map, developed by visual thinking company Xplane, yields a clearer understanding of a stakeholder’s environment, behavior, concerns, and aspirations. This tool uses simple directive questions like what does the person see, think, hear, do and say, plus pains and gains of the individual to develop the stakeholder’s persona.
Empathy Map: Family Doctors
Insights from Step 2
The culmination of the interview and survey analysis, followed by the empathy mapping of the two main stakeholders, resulted in the following insights:
1. Healthcare cuts, overwhelming patient numbers and resulting visit time limits amplify the discriminatory treatment of fat patients by family doctors. Healthcare cuts back in 2014 led to some clinics posting signs indicating patient visits can only last 15 minutes — thus, patients were asked to keep their questions and concerns down to one or two issues (Seth, 2016). According to many of the interview participants from this study, this is a practice that is still exercised today in most clinics.
2. The most significant friction in the relation between the patient and the family doctor comes at the moment of diagnosis. During this point in the service, patients get schooled on their weight and how weight loss will solve their issues. This friction can be conscious, unconscious, or miscommunication, depending on whether the doctor holds more implicit or explicit biases.
3. The moment of diagnosis is a moment of triumph for the doctor. They believe they are treating and helping their fat patients, but this moment is actually a moment of failure and high stress for the fat patient. According to some patient participants from the interviews, they are often unable to explain their frustrations to the doctor. Moreover, if they do, some doctors do not understand it or dismiss it.
This step starts with identifying the leverage points that can be worked with (Systemic Design Toolkit, 2020).
In this project, the data and insights gathered from Steps 1 and 2 will be analyzed in this step using methods such as systems map, causal loops and causal layered analysis to understand the influences and barriers in the system.
Systems Map
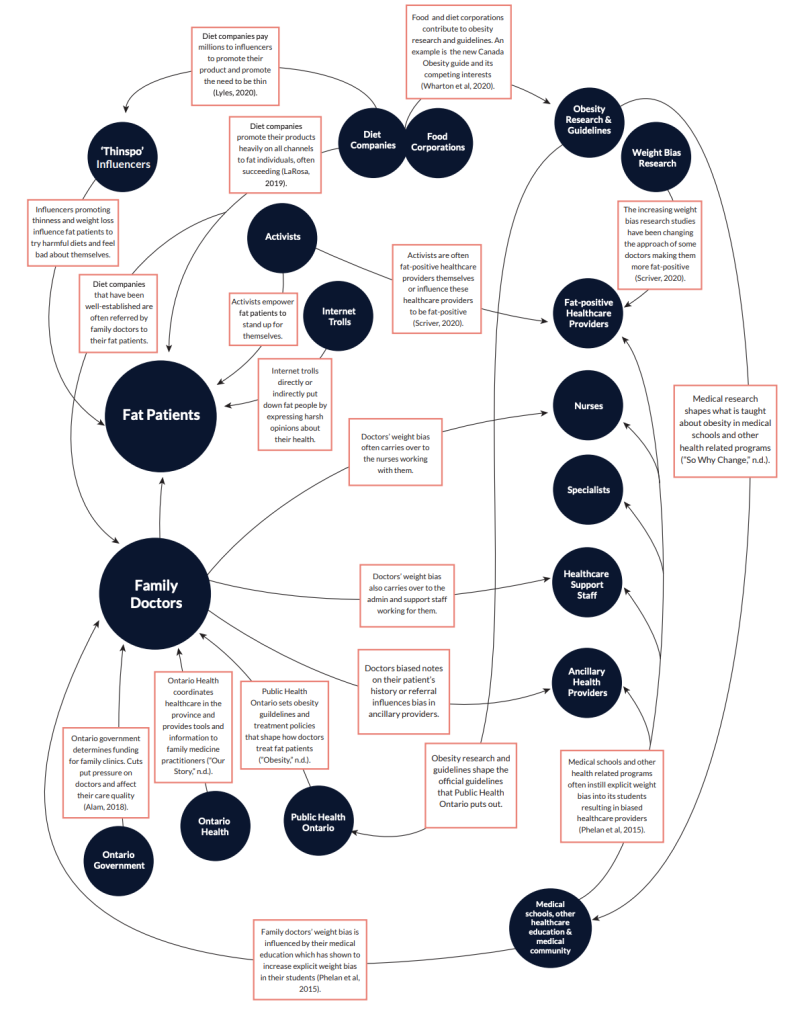
Systems Map is a technique for visualizing the system, its structure and the interrelations between its elements (Systemic Design Toolkit, 2020). For the healthcare weight bias system map, influences were chosen to be plotted for further investigation into the power dynamics that emerged in the Step 1 Actors Map. The map focused on the various sub actors, how they affected each other and the two main stakeholders – fat patients and family doctors.
The map on the following page demonstrates the influences some of the more powerful stakeholders have on the other actors in the system. These influences can be helpful or deterring. They were determined using interview data and various secondary sources.
Influences
Influences
Diet companies pay millions to influencers to promote their product and promote the need to be thin (Lyles, 2020).
Diet companies promote their products.
Food and diet corporations contribute to obesity research and guidelines. An example is the new Canada Obesity guide and its competing interests (Wharton et al, 2020).
Influencers promoting thinness and weight loss influence fat patients to try harmful diets and feel bad about themselves.
Diet companies that have been well-established are often referred by family doctors to their fat patients.
Activists empower fat patients to stand up for themselves.
Activists are often fat-positive healthcare providers themselves or influence these healthcare providers to be fat-positive (Scriver, 2020).
The increasing weight bias research studies have been changing the approach of some doctors making them more fat-positive (Scriver, 2020).
Internet trolls directly or indirectly put down fat people by expressing harsh opinions about their health.

Doctors’ weight bias often carries over to the nurses working with them.
Medical research shapes what is taught about obesity in medical schools and other health related programs (”So Why Change,” n.d.).
Doctors’ weight bias also carries over to the admin and support staff working for them.
Ontario government determines funding for family clinics. Cuts put pressure on doctors and affect their care quality (Alam, 2018).
Ontario Health coordinates healthcare in the province and provides tools and information to family medicine practitioners (”Our Story,” n.d.).
Public Health Ontario sets obesity guildelines and treatment policies that shape how doctors treat fat patients (”Obesity,” n.d.).
Doctors biased notes on their patient’s history or referral influences bias in ancillary providers.
Obesity research and guidelines shape the official guidelines that Public Health Ontario puts out.
Medical schools and other health related programs often instill explicit weight bias into its students resulting in biased healthcare providers (Phelan et al, 2015).
Family doctors’ weight bias is influenced by their medical education which has shown to increase explicit weight bias in their students (Phelan et al, 2015).
When observing the Influence map, an obvious one is that of medical education on family doctors and other healthcare providers, which is the source of most of their knowledge and practices. Another undeniable influence is that of Ontario Health and Public Health Ontario on family doctors. Ontario Health is an agency recently created by the Government of Ontario with a mandate to connect and coordinate the province’s healthcare system. They ensure that health professionals have the tools and information required to deliver the best possible care within their communities (Our Story, n.d.). This new system was introduced in early 2019 by the current provincial government (Jeffords & Jones, 2019). Ontario Public Health, on the other hand, creates health promotion policies and provides education and professional development to Ontario’s health providers (“Ontario Public Health,” 2020).
The big takeaway from these influences is that change initiatives in these two subsystems, education and governance, will be mandatory to solve the issue of weight bias in family medicine today.
A second revelation from the map is the overwhelming societal forces on fat patients. While activists and social media advocates build their confidence and empower them to receive proper healthcare, the same amount of influence is expelled from the opposite side, consisting of ‘thinspiration’ influencers or internet trolls. These conflicting messages often confuse fat patients and further corrode the relationship between them and their biased doctors.
Another striking influence in the system is that of food or dieting corporations on obesity research and guidelines, which shape the protocols encouraged by Public Health Ontario, and thus influence health providers, particularly family doctors. This is problematic because the same protocols that guide our healthcare providers on treating fat patients have contributions from corporations that benefit from the insecurities of fat patients. In a recent Zoom panel hosted by FoodShare Toronto on the topic “Dismantling Fat Shaming and Weight Stigma, one of the panelists, Anshuman Iddamsetty, who is a Toronto-based writer and producer working on fat liberation (Iddamsetty, 2020), pointed out that the new Canadian obesity guideline includes numerous contributors with competing interests. The most questionable contributor is an individual who sells Optifast Meal Replacements through a weight-management center (Foodshare Toronto, 2020). This means someone who makes a profit off of people with obesity has contributed to the national obesity care guidelines. How is that fair? This is an accurate example of how corporate influence shapes the healthcare fat patients receive.
Causal Loops
The influence map provides a robust comprehension of the dynamics in the healthcare weight bias system. Now, the goal is to pinpoint some persistent occurrences that must be interrupted to bring change in the system. This is best achieved by determining causal loops in the system. Causal loop diagrams begin as qualitative descriptions outlining how one thing causes another in either a positive or negative direction. Typically, feedback loops are identified between the different elements. They can be reinforcing, or positive feedback loops, where A produces more B, which in turn produces more A or they can be balancing or negative feedback loops, where a positive change in one leads to a push back in the opposite direction (Peters, 2014).
For this project, existing system archetypes are used to discover the healthcare weight bias system’s feedback loops. System archetypes are feedback loops that capture common anticipated problems that can occur in diverse systems. They are powerful tools for easy diagnosis and identification of problem patterns (Kim, 1992). The two archetypes identified in this system are the Fixes That Fail archetype and Limits to Success archetype.
Fixes That Fail Archetype
In a “Fixes That Fail” archetype, a problem symptom demands resolution. A solution is quickly implemented that alleviates the problem, but it also produces unintended consequences that exacerbate the problem. Over time, the problem symptom returns or is made worse by the same solution that was used to fix it (Kim, 1992).
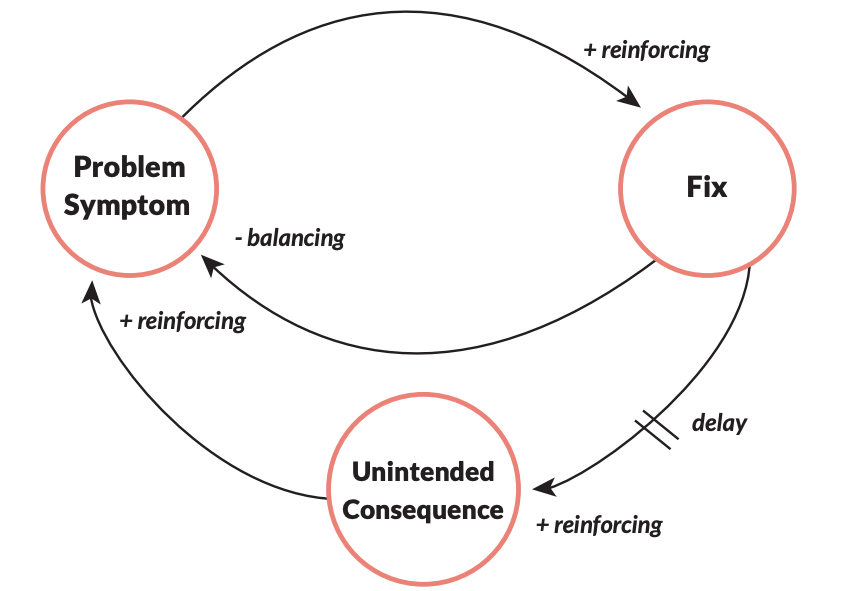
Fixes That Fail Archetype in Use

A central issue in the system, which encapsulates the experiences of the participants interviewed, can be represented by this archetype. Fat patients go to the doctor with health issues. The doctors implement a fix, which is to lose weight. While the fix might temporarily mitigate some of the issues, over time, it results in the unintended consequence of mental health issues, eating disorders and physiological stress, making the initial health issue worse. In summation, weight loss is a fix that often fails.
Limits to Success Archetype
In a “Limits to Success” archetype, continued efforts initially lead to improved performance, but over time the system encounters a limit which causes performance to decline, even if efforts are sustained (Kim, 1992). One of the most frustrating consequences of biased healthcare that fat patients deal with can be represented by the Limits to Success archetype. Fat individuals engage in healthy living by practising good nutrition and physical activity habits and researching Health at Every Size concepts. This motivates them to stay healthy and get preventive healthcare. However, when accessing preventive care, they face bias and judgement, causing various physical and mental health issues, thus dampening their efforts to lead healthy lives. Stigmatizing healthcare limits their success of good health. This stigma is driven by constraints such as biased medical education and lack of health policies against weight bias.
Causal Layered Analysis
Now that influences and persistent problems in the healthcare weight bias system are more apparent, the next move is to learn more about the deeper roots of the issues. This deeper dive into the problem can be conducted using the Causal Layered Analysis (CLA) tool. CLA is a foresight tool that seeks to unpack the deeper future. It has four dimensions (Inayatullah, 2008).A Causal Layered Analysis of weight bias in healthcare revealed the following causes and contributors to the issue:
After completing the CLA, it became evident that the presence of weight bias in healthcare comes down to three implicit beliefs held by society:
1. Fatness is a symbol of greed and gluttony.
2. Death is scary, and obesity quickens it.
3. Doctors are put in a superior position rather than being seen as partners in taking care of our health.
Insights from Step 3
The culmination of Step 3 tools brought forward the following new insights:
- There is not enough qualitative research surrounding obesity, even though the root causes of obesity are linked to emotional, societal and environmental reasons.
- Obesity is often embedded in a one size fits all notion. Fatness looks different for everybody. Different fat people have different health effects if any. However, the treatment is the same for all of them.
- There is a vast disconnect between the governance and medical community subsystems and the advocacy subsystem. The systems mapshowed no direct line of influence. We all know the scientific effects of obesity and weight bias. On the other hand, we have witnessed the social uprising of fat-positive movements and influencers on the internet. However, there is no collaboration between the two to advance the lives of fat people and reduce barriers like weight bias.
Now that we have framed the system, listened to the primary actors through interviews and Empathy Mapping, and tried to understand the system’s connections and deep roots, the next move is to help the stakeholders articulate the common desired future in Step 4.
For this project, this step involved conducting a foresight workshop with the participants who identified as fat patients, to determine their desired future of dismantling weight bias in healthcare.
Primary Research: Three Horizons Workshop Method
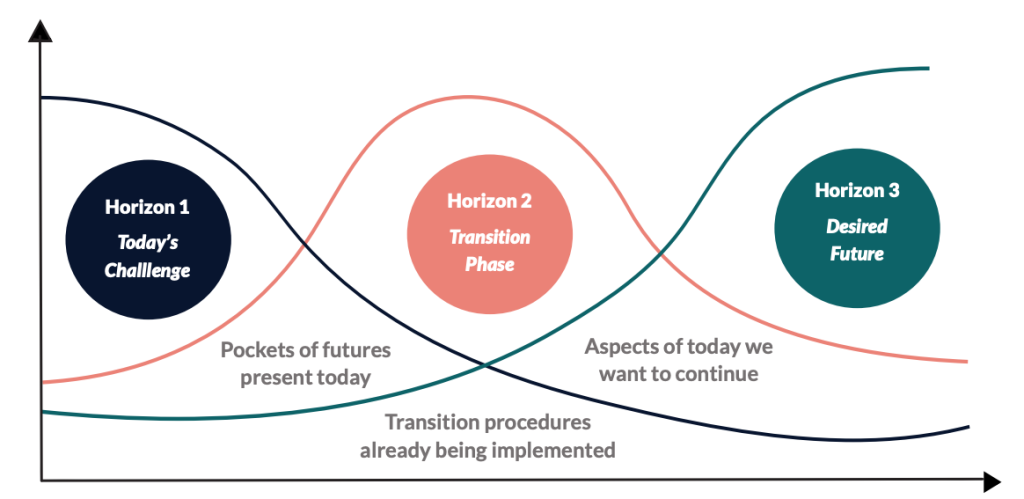
The workshop utilized the foresight tool Three Horizons Framework. Three Horizons is a futures technique that connects the present with desired futures and helps identify the transition stage that emerges from conflict between the embedded present and these imagined futures (Curry & Hodgeson, 2008). Horizon 1 depicts today’s challenges.
Horizon 3 depicts the future one wants. Between them, Horizon 2 demonstrates the transition from today’s challenges to the desired future. The secondary spaces under the horizons are also used to generate points such as pockets of the future present today, aspects of today we want to keep in the future, and transition procedures that are already happening. When using the tool, the starting point would be Horizon 1, listing the challenges, followed by jumping forward to Horizon 3 to share the desired future.
Once those are completed, participants would work through Horizon 2 to discover the transition points needed to reach the goals in Horizon 3.
At the end, the secondary spaces would be tackled. These are based on a specific time period ranging from short-term, like two to five years, to long-term, such as twenty years or more. It varies depending on the industry (Curry & Hodgeson, 2008). The following diagram displays the framework with the definitions.
This tool was built for collaborative use. It is relatively comprehensible and straightforward to use for workshops with non-practitioners (Curry & Hodgeson, 2008).
This is critical when approaching issues like weight bias in healthcare because it allows the actor group most affected by it, the fat patients, to ideate the future they want.
Experience
Workshop participants were recruited at the same time as the interview participants.
Five of the 13 participants from the interviews also opted to participate in the workshop. The criteria were the exact same as interviews. They had to self-identify as fat or be medically classified as overweight and had to have accessed healthcare services in Ontario. On the day of the workshop, one of the participants cancelled, so the workshop was ultimately conducted with four participants.
The session started with an introduction of the framework and how to use it, followed by questions from the facilitator to guide the participants in filling out the Three Horizons framework. The framework was shared through the screen so participants could witness the facilitator writing down the points being made. Participants actively engaged with not only the framework questions but also in discussions with each other. The workshop lasted for an hour and a half.
Media Attributions
- Empathy Map: Fat Patients © "Dismantling Weight Bias Towards Overweight Patients in Ontario Healthcare" by Ireena Haque is licensed under a CC BY-NC-SA (Attribution NonCommercial ShareAlike) license
- Empathy Map: Family Doctors © "Dismantling Weight Bias Towards Overweight Patients in Ontario Healthcare" by Ireena Haque is licensed under a CC BY-NC-SA (Attribution NonCommercial ShareAlike) license
- Influence Systems Map © "Dismantling Weight Bias Towards Overweight Patients in Ontario Healthcare" by Ireena Haque is licensed under a CC BY-NC-SA (Attribution NonCommercial ShareAlike) license
- Doctors © Luis Melendez via. Unsplash is licensed under a CC0 (Creative Commons Zero) license
- Fixes That Fail Archetype © "Dismantling Weight Bias Towards Overweight Patients in Ontario Healthcare" by Ireena Haque is licensed under a CC BY-NC-SA (Attribution NonCommercial ShareAlike) license
- Casual Loops: That Fail Archetype in Use © "Dismantling Weight Bias Towards Overweight Patients in Ontario Healthcare" by Ireena Haque is licensed under a CC BY-NC-SA (Attribution NonCommercial ShareAlike) license
- Three Horizons Framework © "Dismantling Weight Bias Towards Overweight Patients in Ontario Healthcare" by Ireena Haque is licensed under a CC BY-NC-SA (Attribution NonCommercial ShareAlike) license

