
Ecosystem Ecology
Section Goals
By the end of this section, you will be able to do the following:
- Describe how organisms acquire energy in a food web and associated food chains
- Explain how the efficiency of energy transfers between trophic levels affects ecosystem structure and dynamics
- Discuss trophic levels and how ecological pyramids are used to model them
An ecosystem is a community of living organisms and their interactions with their abiotic (non-living) environment. Ecosystems can be small, such as the tide pools found near the rocky shores of many oceans, or large, such as the Amazon Rainforest in Brazil. In this section, we’ll learn about ecosystems and how energy moves within a system.
This next video provides a quick introduction to the concepts we’ll be learning.
How Organisms Acquire Energy in a Food Web
All living things require energy in one form or another. Energy is required by most complex metabolic pathways (often in the form of ATP), especially those responsible for building large molecules from smaller compounds. Life itself is an energy-driven process. Living organisms would not be able to assemble macromolecules (proteins, lipids, nucleic acids, and complex carbohydrates) without a constant energy input.
Energy is acquired by living things in three ways: photosynthesis, chemosynthesis, and the consumption and digestion of other living or previously living organisms by heterotrophs.
Photosynthetic and chemosynthetic organisms are both grouped into a category known as autotrophs: organisms capable of synthesizing their own food (more specifically, capable of using inorganic carbon as a carbon source). Photosynthetic autotrophs (photoautotrophs) use sunlight as an energy source, whereas chemosynthetic autotrophs (chemoautotrophs) use inorganic molecules as an energy source. Autotrophs are critical for all ecosystems. Without these organisms, energy would not be available to other living organisms, and life itself would not be possible.
Photoautotrophs, such as plants, algae, and photosynthetic bacteria, serve as the energy source for a majority of the world’s ecosystems. These ecosystems are often described as grazing food webs. Photoautotrophs harness the solar energy of the sun by converting it to chemical energy in the form of ATP (and NADP). The energy stored in ATP is used to synthesize complex organic molecules, such as glucose.
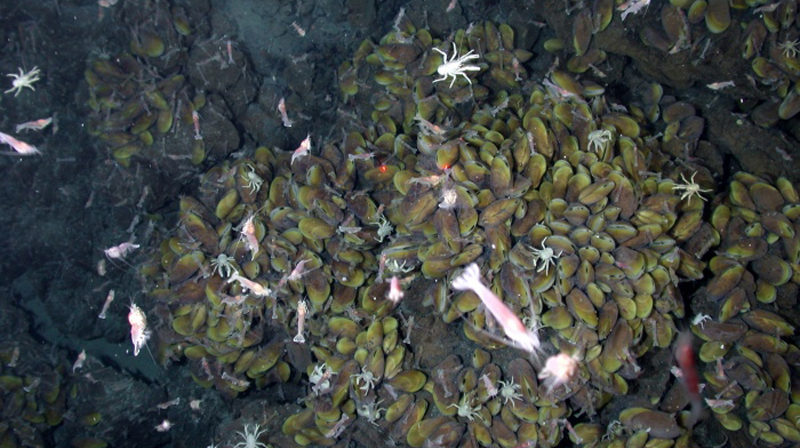
Chemoautotrophs are primarily bacteria that are found in rare ecosystems where sunlight is not available, such as in those associated with dark caves or hydrothermal vents at the bottom of the ocean (Figure 1). Many chemoautotrophs in hydrothermal vents use hydrogen sulfide (H2S), which is released from the vents as a source of chemical energy. This allows chemoautotrophs to synthesize complex organic molecules, such as glucose, for their own energy and in turn supplies energy to the rest of the ecosystem.
Food Chains and Food Webs
Now that we have reviewed how organisms acquire energy, it is important to understand how that energy is passed from one organism to another in the community. In ecology, a food chain is a linear sequence of organisms through which nutrients and energy pass. There is a single path through the chain. For example, if you had a hamburger for lunch, you might be part of a food chain that looks like this: grass → cow → human. Each organism in a food chain occupies what is called a trophic level. Depending on their role as producers or consumers, species or groups of species can be assigned to various trophic levels.
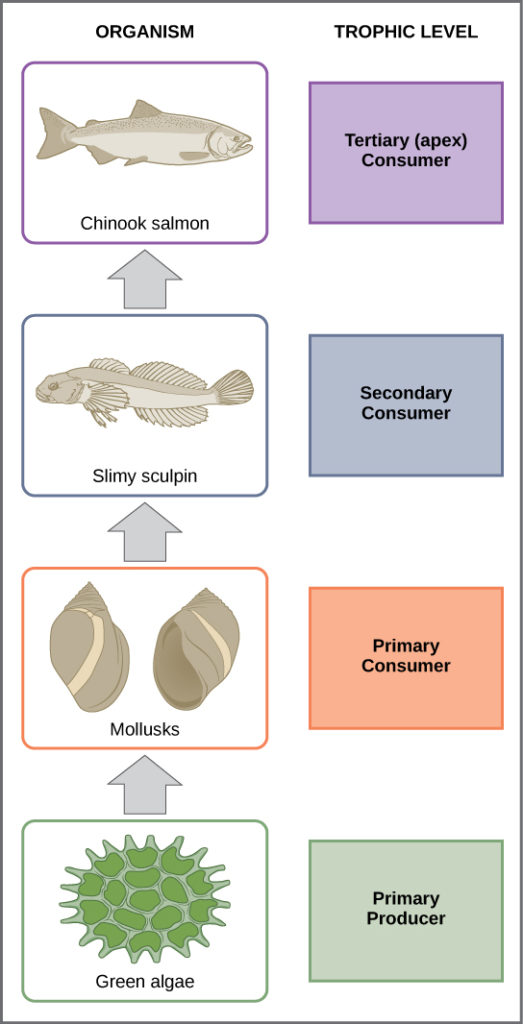
In many ecosystems, the bottom of the food chain consists of photosynthetic organisms (plants and/or phytoplankton), which are called primary producers. The organisms that consume the primary producers are herbivores: the primary consumers. Secondary consumers are usually carnivores that eat the primary consumers. Tertiary consumers are carnivores that eat other carnivores. Higher-level consumers feed on the next lower trophic levels, and so on, up to the organisms at the top of the food chain: the apex consumers. We can see examples of these levels in Figure 2. The green algae are primary producers that get eaten by mollusks—the primary consumers. The mollusks then become lunch for the slimy sculpin fish, a secondary consumer, which is itself eaten by a larger fish, the Chinook salmon—a tertiary and in this case, “apex” consumer.
Did I Get It?
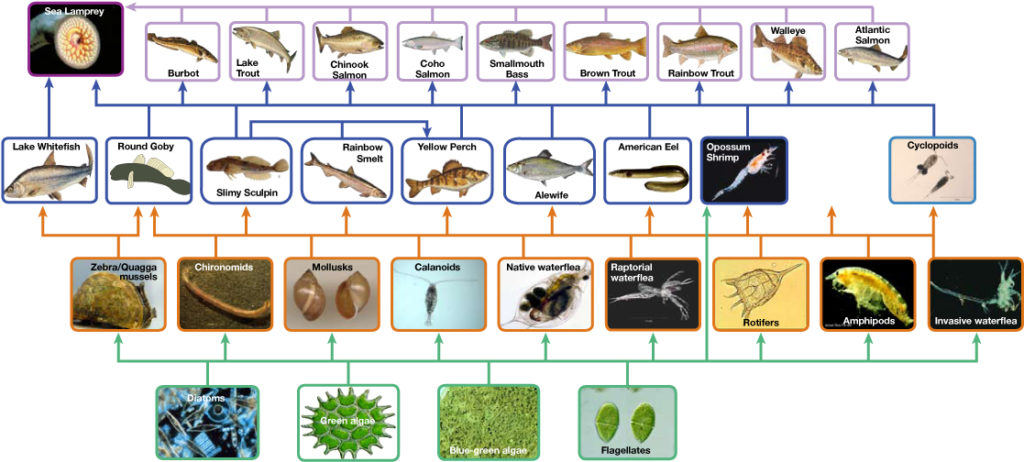
While food chains are flexible for analytical modeling, are easier to follow, and are easier to experiment with, there are problems with using food chains to accurately describe most ecosystems. Even when all organisms are grouped into appropriate trophic levels, some of these organisms can feed on species from more than one trophic level. Consider the hamburger example from above. The source of the hamburger patty is a cow, which is a primary consumer, but the bun is made from wheat, a primary producer. Likewise, any one organism can be eaten by species from multiple trophic levels. In other words, the linear model of ecosystems, the food chain, is not a true representation of ecosystem structure. Instead, a food web is a holistic model—which accounts for all the interactions between different species and their complex interconnected relationships with each other and with the environment. A food web is a graphic representation of a non-linear web of primary producers, primary consumers, and higher-level consumers (Figure 3). Food webs more accurately represent ecosystem structure and dynamics, and data can be directly used as input for simulation modeling.
Ecosystems are often depicted as having bottom-up control, where the most biomass exists in producers that then support progressively smaller populations of herbivores, carnivores, and so on. In other words, the lowest trophic level dictates the community structure above it based on how much energy it can fix in photosynthesis. However, you might also find top-down control in an ecosystem. With top-down control, the predators/top carnivores are controlling things. Their numbers and behavior dictate how many prey are found, which in turn dictates how many plants and autotrophs are consumed. In this way, in ecosystems, top predators, often at the highest trophic level, play a critical role in regulating the populations of species at lower trophic levels. They do so by controlling the abundance of herbivores or lower-level consumers. When top predators are present and exert their influence, they can limit the populations of herbivores, which in turn can lead to changes in the abundance of primary producers (plants) that are the primary food source for herbivores. These effects can cascade through the ecosystem, affecting multiple trophic levels. In some ecosystems, these top predators control the herbivore populations so that the herbivore populations do not explode, which could lead to overgrazing of plant communities, which can have detrimental effects on ecosystem structure and diversity.
In the next video, enter a kelp forest to see an example of top-down control and to explore the effects of changes in the dynamics of organisms in this diverse ecosystem using food web models. Be sure to pause the video when prompted to formulate your own predictions for the questions presented!
Another classic example of top-down control theory is the reintroduction of wolves into Yellowstone National Park in the United States. With the return of wolves, the populations of elk, which were overgrazing and affecting plant communities, were controlled.
So the return of wolves had cascading effects, leading to a more diverse and balanced ecosystem, as illustrated in the next video:
Transfer of Energy Between Trophic Levels
One major factor that limits the length of any given food chain is energy. Energy can pass from one trophic level to the next when organic molecules from an organism’s body are eaten by another organism. However, the transfer of energy between trophic levels is not usually very efficient. The loss of energy between trophic levels is illustrated in Figure 4 below.
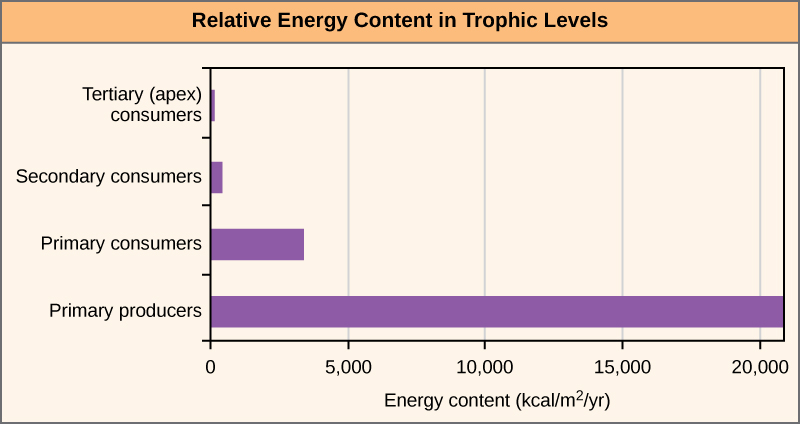
On average, only about 10% of the energy stored as biomass in one trophic level (e.g., primary producers) is converted into biomass and becomes available as food for the next trophic level (e.g., primary consumers). That means that at the first trophic level, autotrophs are using ~90% of the energy that they fix during photosynthesis. They are using the energy to grow taller, grow more roots, produce flowers, and engage in metabolic processes. During such conversions, some energy may be lost as heat. When a primary consumer eats the plants, they will not be able to successfully assimilate all the energy as well. Some molecules are not digestible by the consumer and are lost in its feces (poop). Further, of the energy-carrying molecules that do get absorbed by the consumer, some are used in cellular respiration (instead of being stored as biomass). This is why the amount of energy decreases so quickly as you move up the trophic levels and why you will find a limited number of trophic levels in any one ecosystem or community. There may not be enough energy remaining in the food chain to support viable populations at a higher trophic level. This concept is called the 10% rule and is a fundamental concept in ecosystem ecology.
The efficiency of energy use by each trophic level also varies. That is, how well organisms use and incorporate the energy from food into biomass to fuel the next trophic level. In general, cold-blooded animals (ectotherms), such as invertebrates, fish, amphibians, and reptiles, use less of the energy they obtain for respiration and heat than warm-blooded animals (endotherms), such as birds and mammals. The extra heat generated in endotherms, although an advantage in terms of the activity of these organisms in colder environments, is a major disadvantage in terms of efficiency. Therefore, many endotherms have to eat more than ectotherms to get the energy they need for survival.
The inefficiency of energy use by warm-blooded animals has broad implications for the world’s food supply. It is widely accepted that the meat industry uses large amounts of crops to feed livestock, and because the energy efficiency is low, much of the energy from animal feed is lost. For example, it costs about $0.01 to produce 1000 dietary calories (kcal) of corn or soybeans, but approximately $0.19 to produce a similar number of calories growing cattle for beef consumption. The same energy content of milk from cattle is also costly, at approximately $0.16 per 1000 kcal. Thus, there has been a growing movement worldwide to promote the consumption of nonmeat and nondairy foods so that less energy is wasted feeding animals for the meat industry.
Ecological Pyramids: Modeling Ecosystem Energy Flow
Ecological pyramids provide an intuitive, visual picture of how the trophic levels in an ecosystem compare for a particular parameter (such as energy flow, biomass, or number of organisms). Let’s take a look at these three types of pyramids and see how they reflect the structure and function of ecosystems.
- Energy pyramids represent energy flow through trophic levels. For instance, the pyramid below shows gross productivity for each trophic level in the Silver Springs ecosystem. An energy pyramid usually shows rates of energy flow through trophic levels, not absolute amounts of energy stored. It can have energy units, such as kcal/m2/yr, or biomass units, such as g/m2/yr.
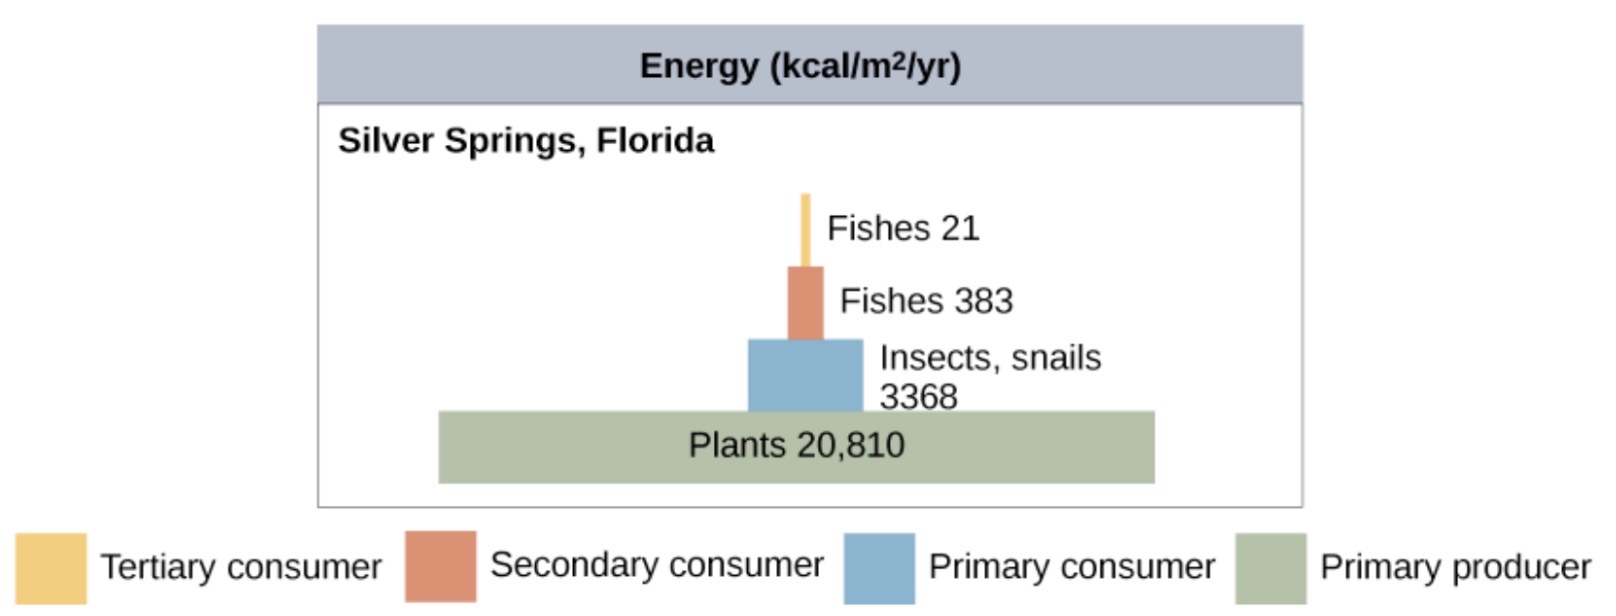
Figure 5. Image modified from “Energy flow: Figure 3,” by OpenStax College, Biology CC BY 4.0. Energy pyramids are always upright, that is, narrower at each successive level (unless organisms enter the ecosystem from elsewhere). This pattern reflects the laws of thermodynamics, which tell us that new energy can’t be created, and that some must be converted to a form that cannot be used to do work (e.g., heat) in each transfer. An ecosystem without sufficient primary productivity cannot be supported.
- Another way to visualize ecosystem structure is with biomass pyramids. Biomass is the total mass, in a unit area at the time of measurement, of living or previously living organisms within a trophic level. A biomass pyramid measures the amount of energy converted into living tissue at the different trophic levels.Below on the left, we can see a biomass pyramid for the Silver Springs ecosystem. This pyramid, like many biomass pyramids, is upright. However, the biomass pyramid shown on the right – from a marine ecosystem in the English Channel – is upside-down (inverted).
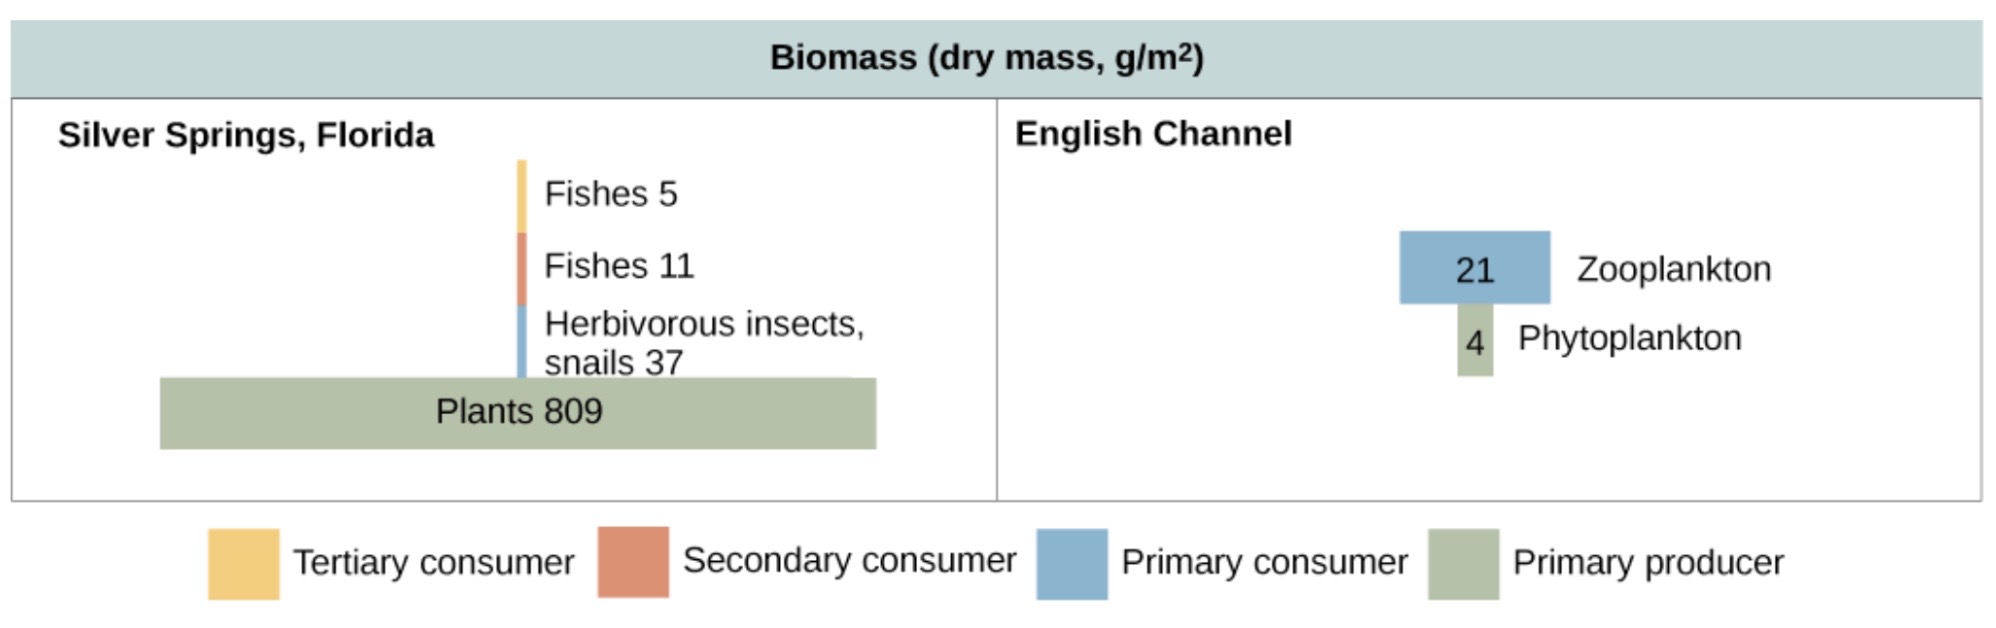
Figure 6. Image modified from “Energy flow: Figure 3,” by OpenStax College, Biology CC BY 4.0. The inverted pyramid is possible because of the high turnover rate of the phytoplankton. They get rapidly eaten by the primary consumers (zooplankton), so their biomass at any point in time is small. However, they reproduce so fast that, despite their low steady-state biomass, they have high primary productivity that can support large numbers of zooplankton.
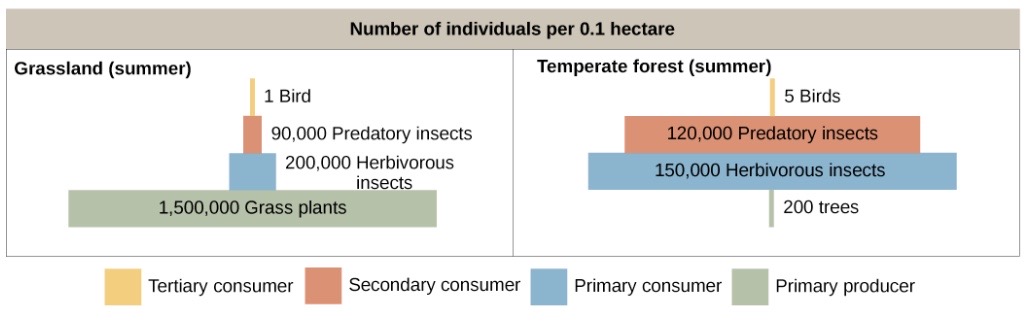
- Numbers pyramids show how many individual organisms there are in each trophic level. They can be upright, inverted, or kind of lumpy, depending on the ecosystem.As shown in the figure below, a typical grassland during the summer has a base of numerous plants, and the numbers of organisms decrease at higher trophic levels. However, during the summer in a temperate forest, the base of the pyramid instead consists of a few plants (mostly trees) that are vastly outnumbered by primary consumers (mostly insects). Because individual trees are big, they can support the other trophic levels despite their small numbers.
To review, pyramids of organisms may be inverted or diamond-shaped because a large organism, such as a tree, can sustain many smaller organisms. Likewise, a low biomass of organisms can sustain a larger biomass at the next trophic level because the organisms reproduce rapidly and thus supply continuous nourishment. Energy pyramids, however, must always be upright because of the laws of thermodynamics. The first law of thermodynamics states that energy can neither be created nor destroyed; thus, each trophic level must acquire energy from the trophic level below. The second law of thermodynamics states that, during the transfer of energy, some energy is always lost as heat; thus, less energy is available at each higher trophic level.
So which type of pyramid is best? Each type of pyramid provides slightly different information about an ecosystem and how energy is stored in, and moves through, that ecosystem’s trophic levels. There is no one “best pyramid,” and the pyramid that’s most useful will depend on what question we are asking about the ecosystem.
Biological Amplification or Biomagnification
One of the most important environmental consequences of ecosystem dynamics is biomagnification. Biomagnification is the increasing concentration of persistent, toxic substances in organisms at each trophic level, from the primary producers to the apex consumers. Many substances have been shown to bioaccumulate, including the pesticide dichlorodiphenyltrichloroethane (DDT), which was described in the 1960s bestseller Silent Spring by marine biologist Rachel Carson. DDT was a commonly used pesticide before its dangers became known. In some aquatic ecosystems, organisms from each trophic level consumed many organisms of the lower level, which caused DDT to increase in birds (apex consumers) that ate fish. Thus, the birds accumulated sufficient amounts of DDT to cause fragility in their eggshells. This effect increased egg breakage during nesting and was shown to have adverse effects on these bird populations. Carson’s combination of scientific knowledge and illuminating writing helped raise awareness about overall environmental issues as well as the specifics of the pesticide. The use of DDT was banned in the United States in the 1970s.
In the early 1950s, there was an outbreak of malaria in Borneo (now Indonesia). The World Health Organization tried to solve the problem. They sprayed large amounts DDT to kill the mosquitoes that carried the malaria. The mosquitoes indeed died and there was less malaria. That was good. However, there were side effects. One of the first effects was that the roofs of people’s houses (which were thatched roofs) began to fall down on their heads. It turned out that the DDT was also killing a parasitic wasp that ate thatch-eating caterpillars. Without the wasps to eat them, there were more and more thatch-eating caterpillars. Worse than that, the insects that died from being poisoned by DDT were eaten by gecko lizards, this caused the geckos nerve damage which slowed their reflexes and made them more likely to be eaten by cats. The cats started to die of DDT poisoning, the rats flourished, and the people were threatened by outbreaks of two new serious diseases carried by the rats, Sylvatic plague and Typhus. To cope with these problems, which it had itself created, the World Health Organization had to parachute live cats into Borneo to eat the rats![1]
Watch this whiteboard animation telling the cautionary tale of cats in Borneo and what can happen when decisions are made without understanding the interconnectedness in nature:
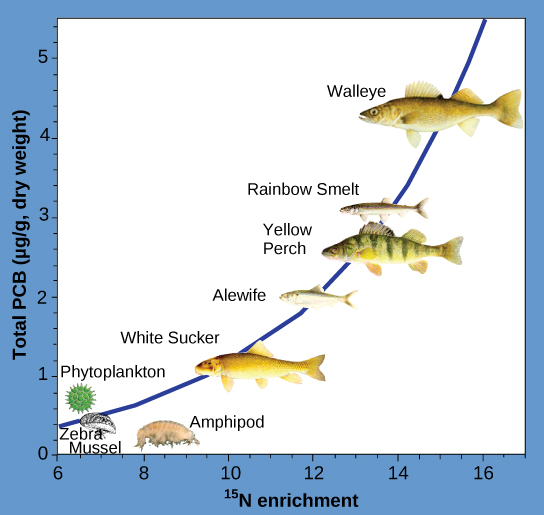
Other substances that biomagnify are polychlorinated biphenyls (PCBs), which were used in coolant liquids in the United States until their use was banned in 1979, and heavy metals, such as mercury, lead, and cadmium. These substances were best studied in aquatic ecosystems, where fish species at different trophic levels accumulate toxic substances brought through the ecosystem by the primary producers. As illustrated in a study performed by the National Oceanic and Atmospheric Administration (NOAA) in the Saginaw Bay of Lake Huron (Figure 8), PCB concentrations increased from the ecosystem’s primary producers (phytoplankton) through the different trophic levels of fish species. The apex consumer (walleye) has more than four times the amount of PCBs compared to phytoplankton. Also, based on results from other studies, birds that eat these fish may have PCB levels at least one order of magnitude higher than those found in the lake fish.
Other concerns have been raised by the accumulation of heavy metals, such as mercury and cadmium, in certain types of seafood. The United States Environmental Protection Agency (EPA) recommends that pregnant people and young children should not consume any swordfish, shark, king mackerel, or tilefish because of their high mercury content. These individuals are advised to eat fish low in mercury: salmon, tilapia, shrimp, pollock, and catfish. Biomagnification is a good example of how ecosystem dynamics can affect our everyday lives, even influencing the food we eat.
CC Licensed Content, Shared Previously, Included in How Organisms Get Energy
- Biology 2e. Authors: Mary Ann Clark, Matthew Douglas and Jung Choi. Provided by: OpenStax CNX. Located at: Biology 2e. License: CC BY: Attribution 4.0.
- Biology for Majors II. Authors: Shelly Carter and Monisha Scott. Provided by: Lumen Learning. Located at: Biology for Majors II | Simple Book Production. License: CC BY: Attribution 4.0.
- Introductory Biology: Ecology, Evolution, and Biodiversity Author: Erica Kosal. Provided by: Pressbooks. Located at: Introductory Biology: Ecology, Evolution, and Biodiversity – Simple Book Publishing. License: CC BY-NC 4.0.
- Food Chains & Food Webs. Provided by: Khan Academy. Located at: Food Chains & Food Webs (article)| Ecology | Khan Academy License: CC BY-NC-SA 4.0
- Energy Flow & Primary Productivity. Provided by: Khan Academy. Located at: Energy Flow & Primary Productivity (article)| Ecology | Khan Academy License: CC BY-NC-SA 4.0
- O'Shaughnessy PT. Parachuting cats and crushed eggs the controversy over the use of DDT to control malaria. Am J Public Health. 2008 Nov;98(11):1940-8. doi: 10.2105/AJPH.2007.122523. ↵
