Chapter 3: Functions
Print Version Only Chapter 3 Functions – Informal Math Modeling

In this chapter…
- 3.1 Introduction to Functions
- 3.2 Average Rate of Change
- 3.3 Reading Function Graphs
“Mathematicians do not study objects, but relations among objects; they are indifferent to the replacement of objects by others as long as relations do not change. Matter is not important, only form interests them”
quote by the late French mathematician Henri Poincare
Perhaps, without knowing it, we have already looked at so-called “functions” in previous sections while exploring the relationship between figures in a pattern and their corresponding quantities, such as number of tiles, perimeter etc. We will define “functions” more formally later; for now, let us note that functions are special relationships between sets of objects/numbers.
Whenever we find an explicit formula to express some quantity (based on another quantity), we establish a relationship between the two quantities. This type of relationship is called a function.
In this chapter we explore different representations of functions and their properties. First we highlight corresponding national and state standards.
According to the National Council of Teachers of Mathematics (NCTM) Principles and Standards for School Mathematics…
In prekindergarten through grade 2 all students should…
- recognize, describe, and extend patterns such as sequences of sounds and shapes or simple numeric patterns and translate from one representation to another
- describe qualitative change, such as a student’s growing taller
In grades 3–5 all students should…
- represent and analyze patterns and functions, using words, tables, and graphs
- investigate how a change in one variable relates to a change in a second variable
In grades 6–8 all students should…
- represent, analyze, and generalize a variety of patterns with tables, graphs, words, and, when possible, symbolic rules
- relate and compare different forms of representation for a relationship
- model and solve contextualized problems using various representations, such as graphs, tables, and equations
In the Massachusetts Mathematics Curriculum Framework…
Grade 5 – 5.OA.B. Analyze patterns and relationships.
- Generate two numerical patterns using two given rules. Identify apparent relationships between corresponding terms. Form ordered pairs consisting of corresponding terms from the two patterns, and graph the ordered pairs on a coordinate plane.
Grade 6 – 6.EE.C. Represent and analyze quantitative relationships between dependent and independent variables.
- Use variables to represent two quantities in a real-world problem that change in relationship to one another; write an equation to express one quantity, thought of as the dependent variable, in terms of the other quantity, thought of as the independent variable. Analyze the relationship between the dependent and independent variables using graphs and tables, and relate these to the equation.
Grade 8
8.F.A. Define, evaluate, and compare functions.
- Understand that a function is a rule that assigns to each input exactly one output. The graph of a function is the set of ordered pairs consisting of an input and the corresponding output.
- Compare properties of two functions each represented in a different way (algebraically, graphically, numerically in tables, or by verbal descriptions).
8.F.B. Use functions to model relationships between quantities.
- Construct a function to model a linear relationship between two quantities. Determine the rate of change and initial value of the function from a description of a relationship or from two (x, y) values, including reading these from a table or from a graph. Interpret the rate of change and initial value of a linear function in terms of the situation it models, and in terms of its graph or a table of values.
- Describe qualitatively the functional relationship between two quantities by analyzing a graph (e.g., where the function is increasing or decreasing, linear or nonlinear). Sketch a graph that exhibits the qualitative features of a function that has been described verbally.
It is worth noting that elementary school teachers should be well versed in middle school mathematics. Think about it as knowing what your students will face in the future in order to be qualified to prepare them for it. Teachers should also be able to foreshadow future mathematics for their students and answer questions about how concepts in mathematics will build upon each other.
A formula for the nth term of a sequence in which we may plug in the value of n to determine the nth term without using previous terms.
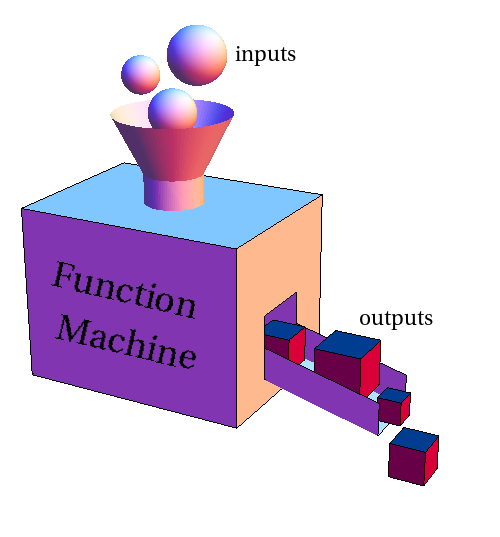
A relationship between a set of input values and a set of output values, such that each input value is matched to EXACTLY ONE output value.
a letter that represents a quantity that may vary
The variable that represents output values in a function.
The variable that represents input values in a function.

