2.4 Box plots

Problem 1

The following are boxplots of the numbers of hits at a certain website for the different days of the week.

The graph shows seven vertical box plots, one for each day of the week, that represent the number of website hits that day. On Monday, the bottom whisker starts at 500, the bottom of the box is at 900, midline at 1050, top of box at 1450, and the top whisker extends to 1950. On Tuesday, the five number summary is 350, 880, 1080, 1320, and 1990. On Wednesday, March 3 is an outlier at 500, and the five number summary is 600, 950, 1100, 1230, and 1600. On Thursday, January 8 is an outlier at 230, and the five number summary is 430, 920, 1020, 1240, and 1400. On Saturday, January 2 is an outlier at 100; the five number summary is 180, 310, 400, 420, and 570; and February 6 and 27 are outliers at 600 and 900, respectively. On Sunday, the five number summary is 120, 310, 490, 550, and 700.

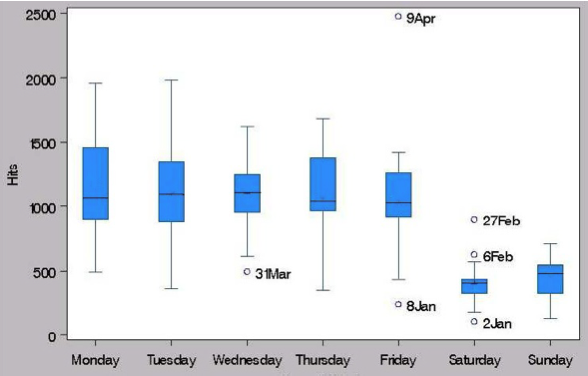
1. Which days had outliers?

  1. Sunday
  2. Monday
  3. Tuesday
  4. Wednesday
  5. Thursday
  6. Friday
  7. Saturday

2. Which day had the largest median?

3. Which day had the largest 3rd quartile?

4. Less than 25 percent of Thursdays had a higher number of hits than the busiest Saturday.

  • True
  • False
Correct Answers
  1. DFG
  2. Wednesday
  3. Monday
  4. False

Problem 2

Consider the following box and whisker plot. Find the indicated values of the represented data.
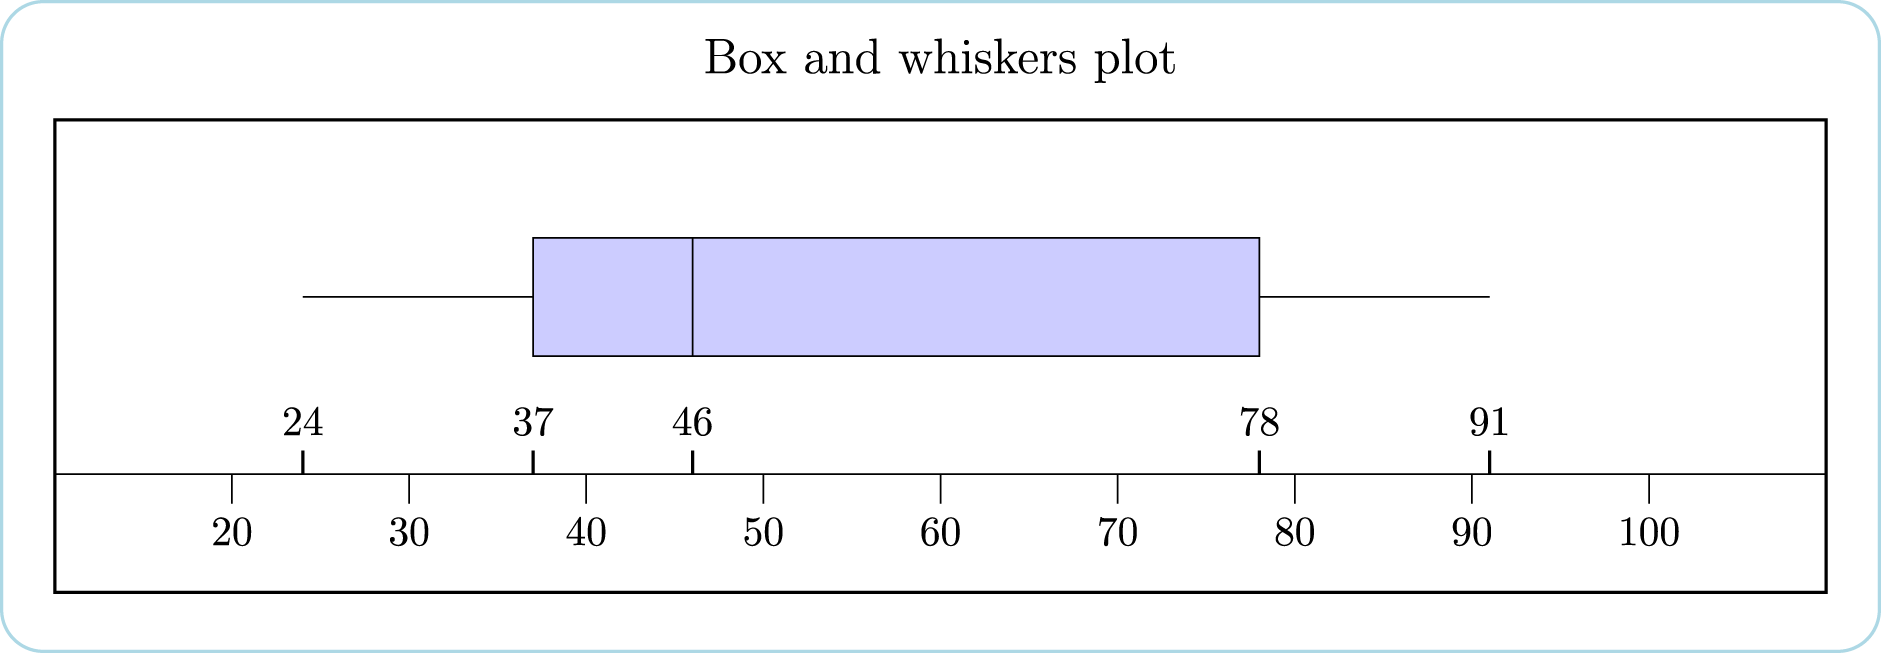
Box and whiskers plot. The left whisker is from 24 to 37. The box is between 37 and 78. The middle line is at 46 and the right whisker runs from 78 to 91

  1. Minimum:
  2. First quartile:
  3. Median:
Correct Answers
  1. 24
  2. 37
  3. 46

Problem 3

Consider the following box and whisker plot. Match the letters with the values.

Box and whiskers plot. The left whisker is from 15 to 37. The box is between 37 and 79. The middle line is at 70 and the right whisker runs from 79 to 94

  1. X
  2. Y
  3. Z
  1. Mean
  2. Q1
  3. Max
  4. Right Pivot
  5. Q3


Correct Answers
  1. B
  2. C
  3. E

Problem 4

The boxplot below represents annual salaries of attorneys in thousands of dollars in Los Angeles.

Box and whiskers plot for salaries listed in thousands of dollars. The left whisker is from 152 to 195. The box is between 195 and 308. The middle line is at 252 and the right whisker runs from 308 to 351

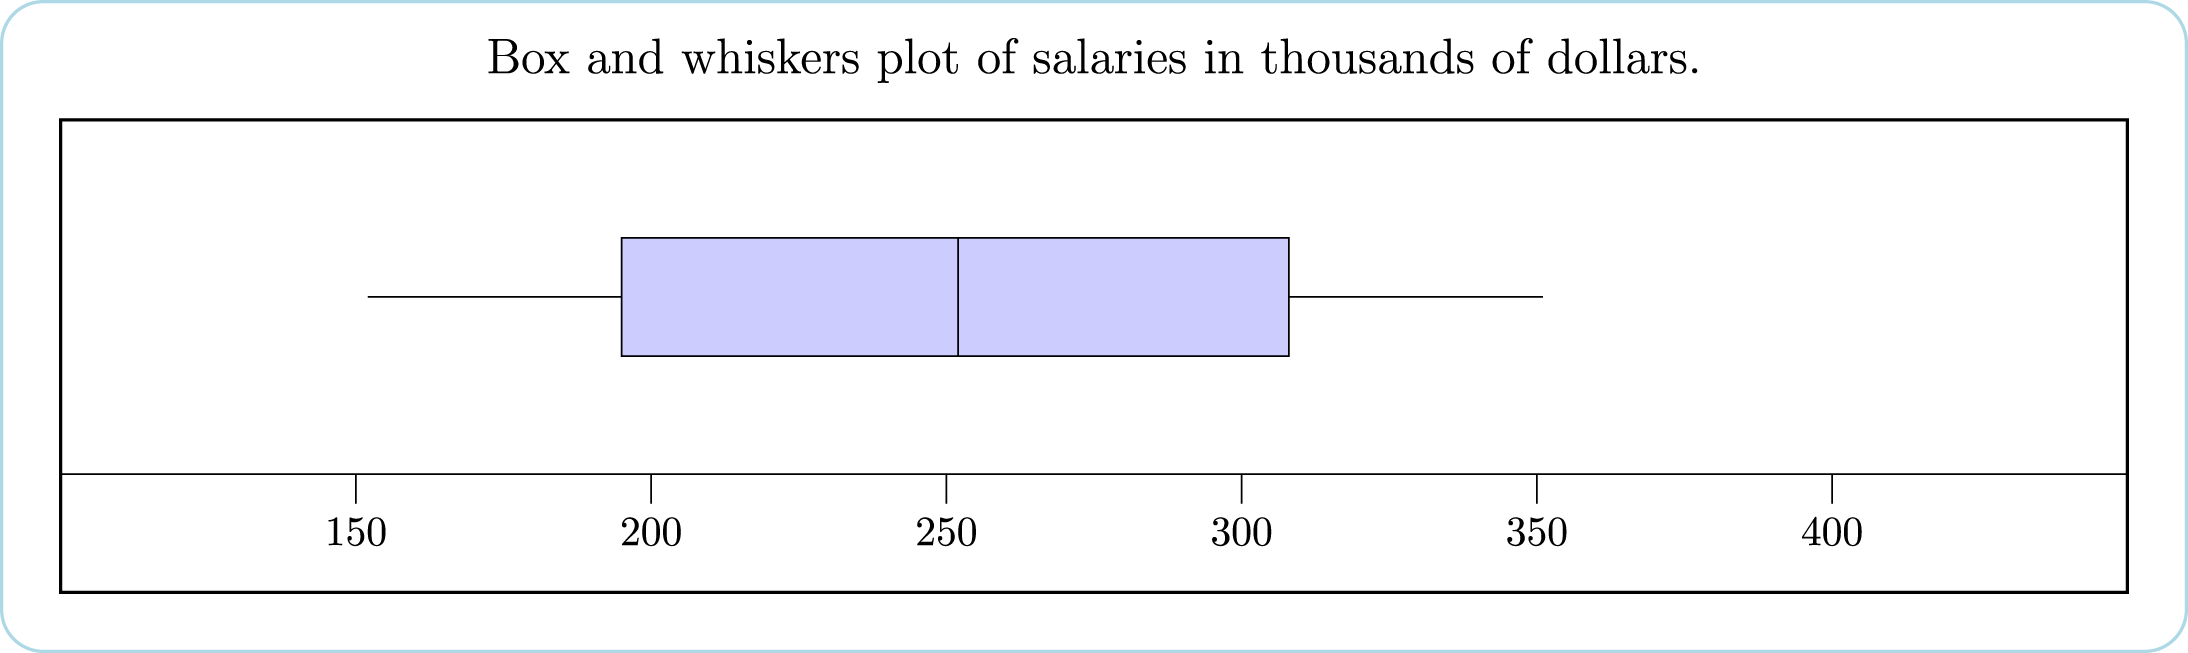
About what percentage of the attorneys have salaries between $152,000 and $252,000?

  • 10
  • 30
  • 35
  • 50
  • None of these


Correct Answers

50

Problem 5

A boxplot for a set of data is given below. Find the five-number summary.
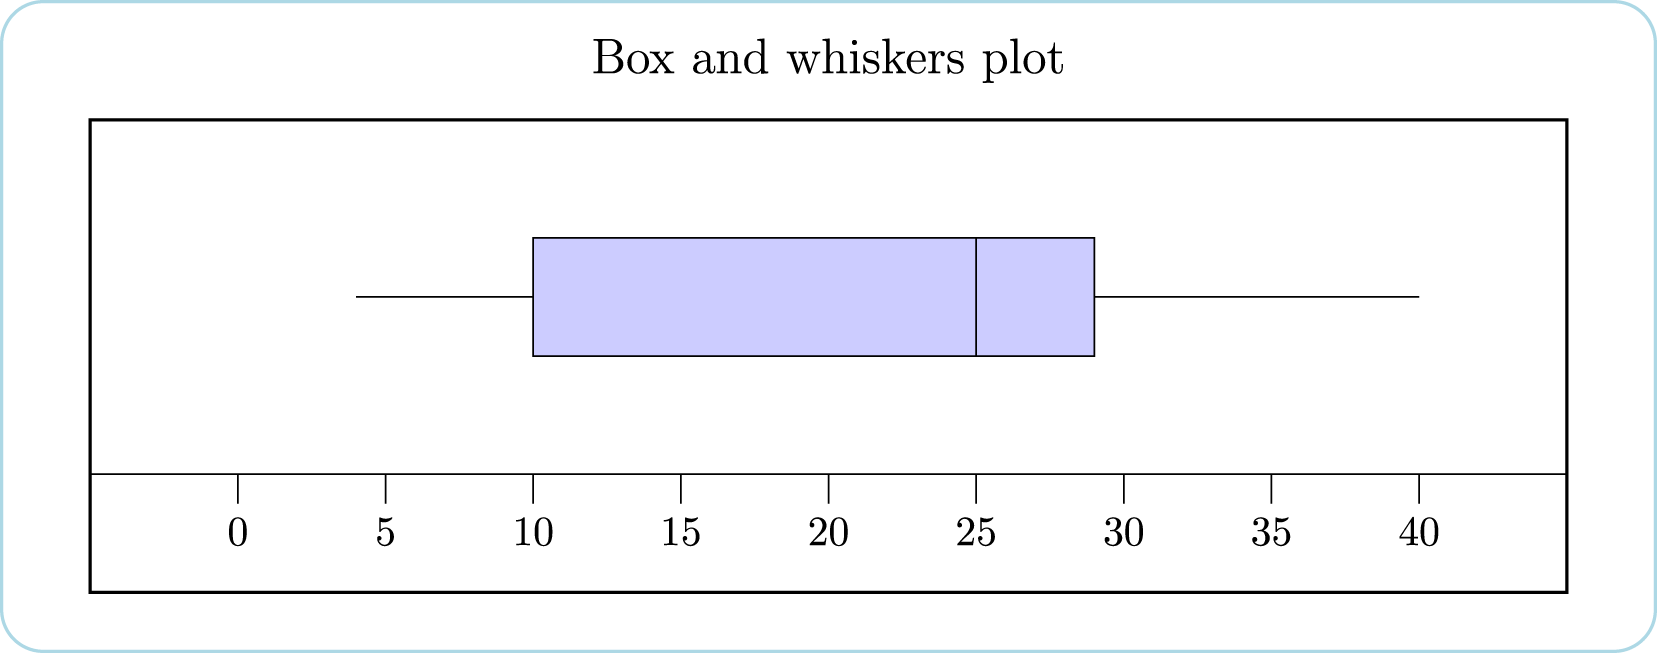
Box and whiskers plot. The left whisker is from 4 to 10. The box is between 10 and 29. The middle line is at 25 and the right whisker runs from 29 to 40

Find the minimum:

Find Q1:

Find the median:

Find Q3:

Find the maximum:


Correct Answers

Minimum: 4

Q1: 10

Median: 25

Q3: 29

Maximum: 40

License

Icon for the Creative Commons Attribution-NonCommercial-ShareAlike 4.0 International License

Statistical Problem Sets in WeBWorK Copyright © 2023 by Rachael Norton and Peter Staab is licensed under a Creative Commons Attribution-NonCommercial-ShareAlike 4.0 International License, except where otherwise noted.

Share This Book