
2.5 Center of data
Problem 1
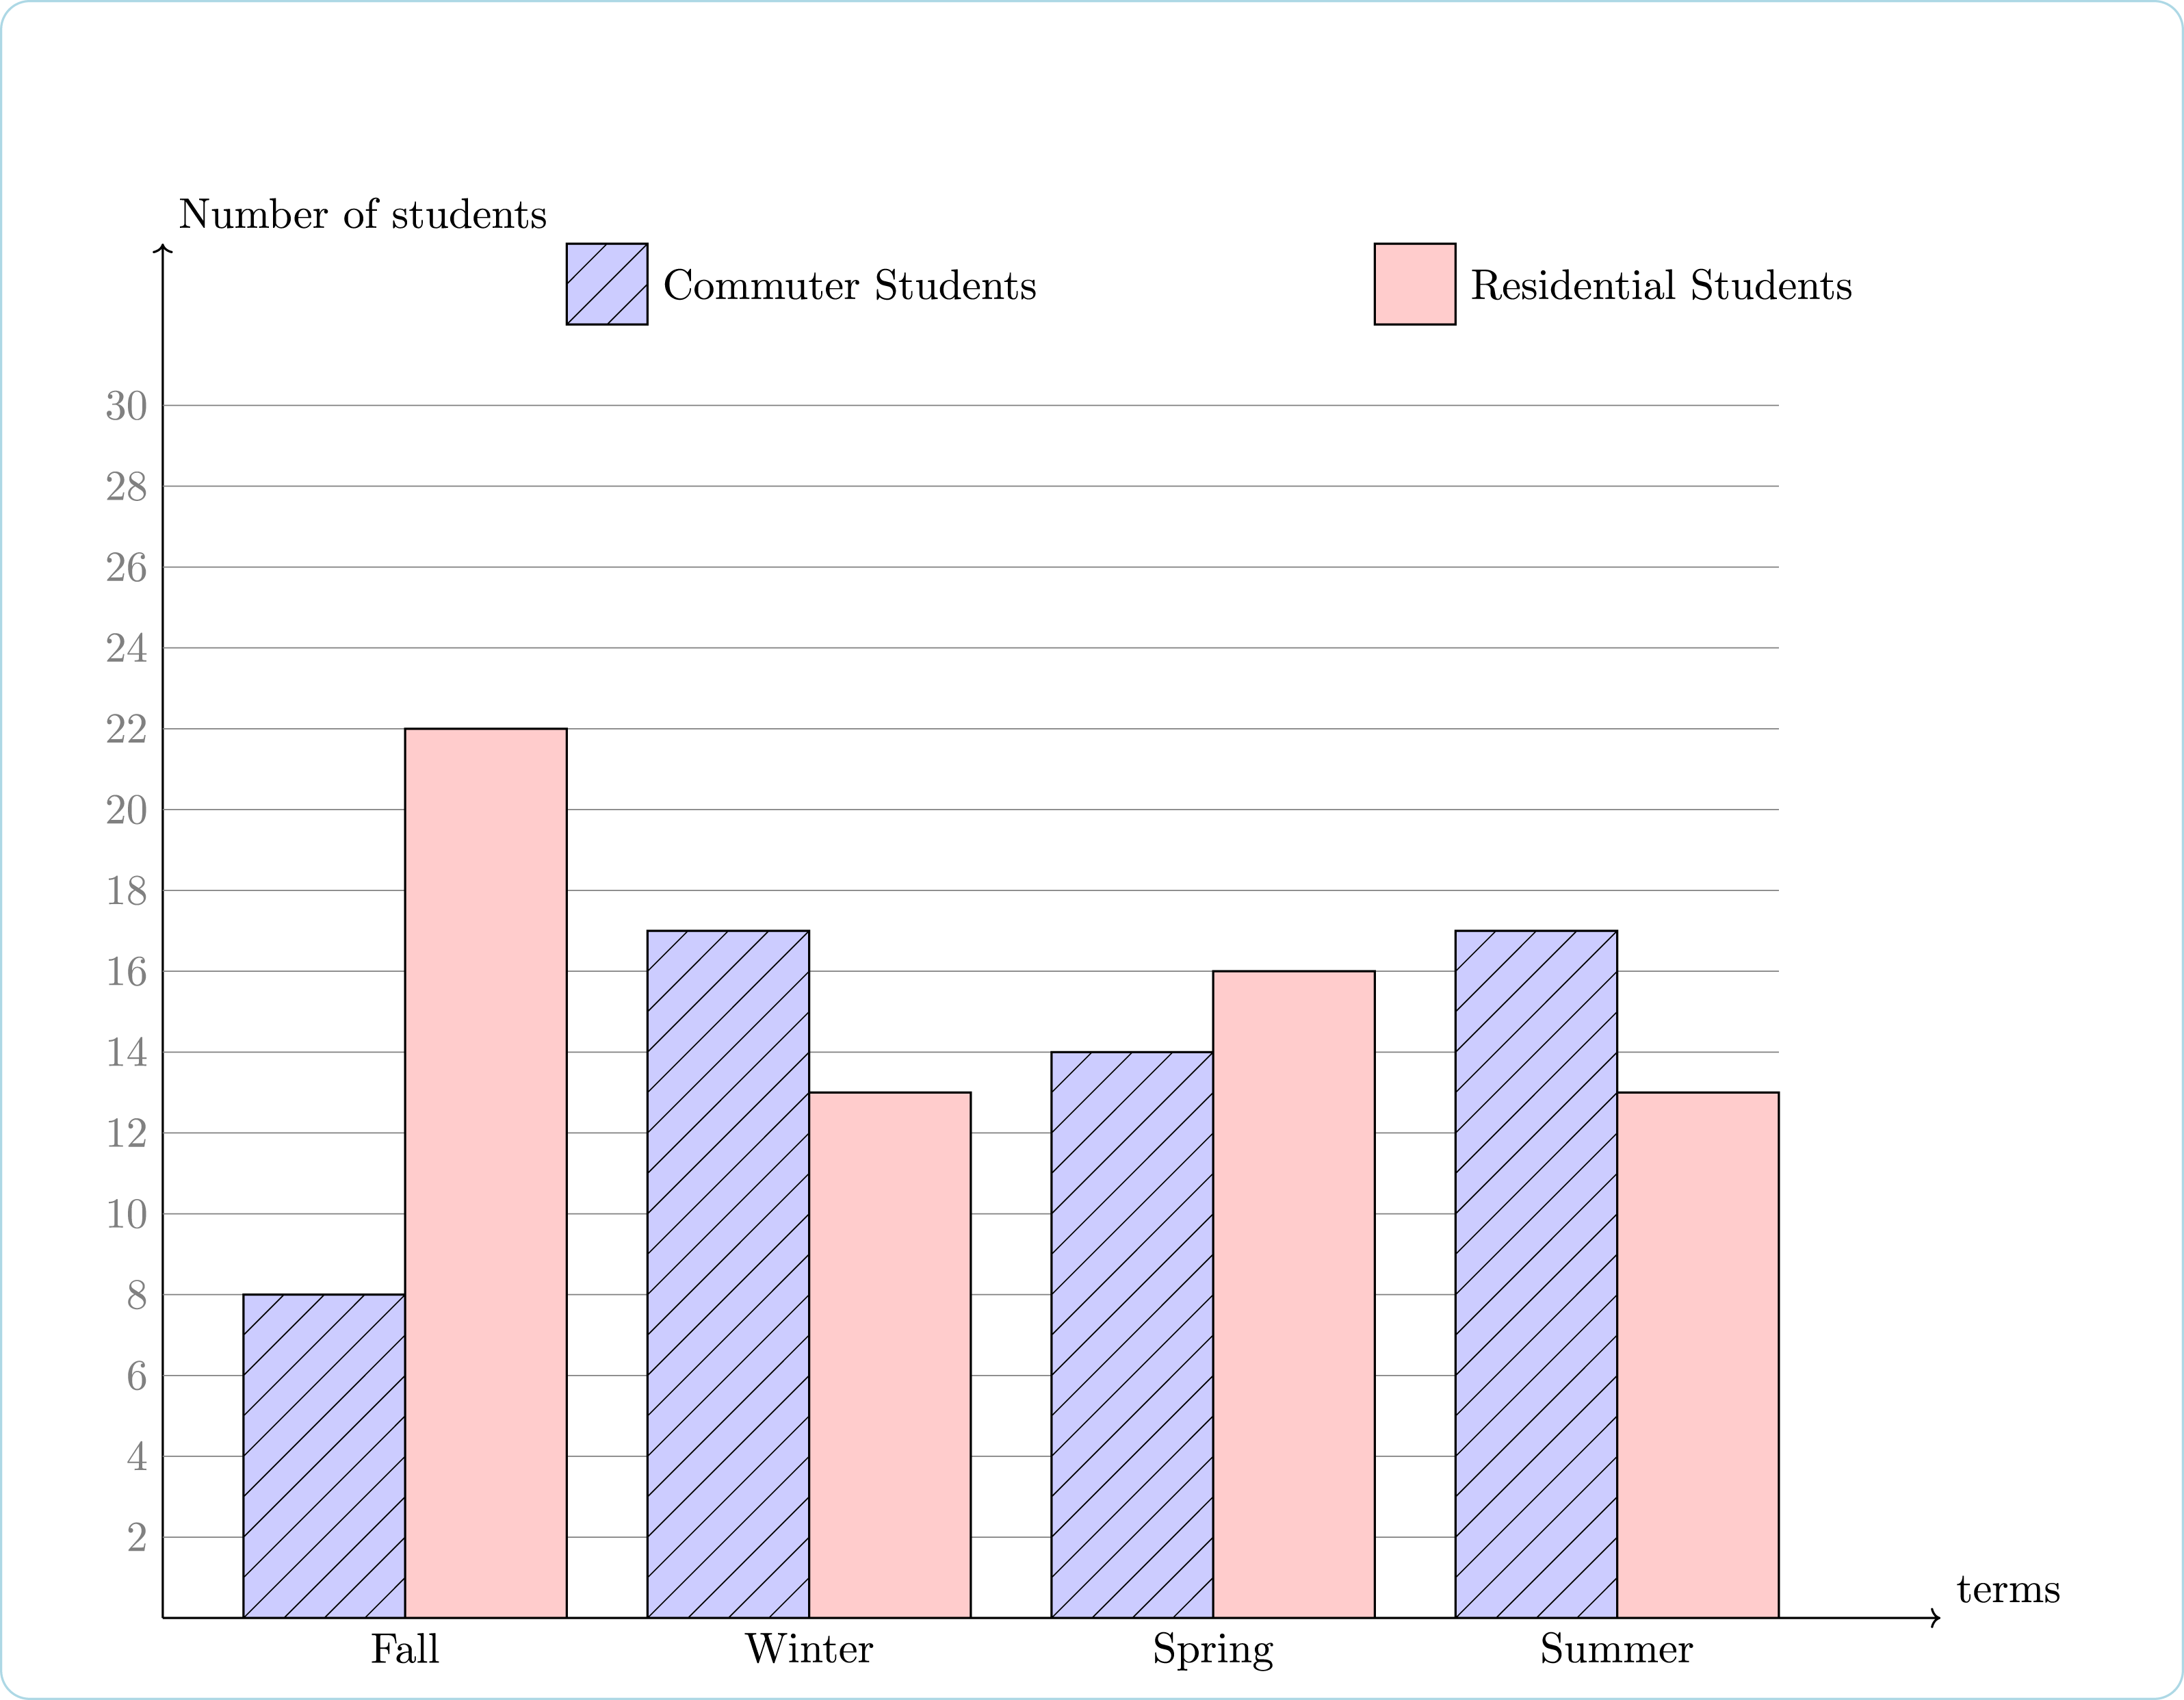
This bar graph compares commuter and residential student enrollment in a certain class at a college in a certain school year.
Answer the following questions.
Question 1: In these 4 terms, the mean number of commuter students in this class was:
Question 2: In these 4 terms, the mean number of residential students in this class was:
Question 3: In these 4 terms, the median of commuter students in this class was:
Question 4: In these 4 terms, the median of residential students in this class was:
Question 5: If you want to know, in all 4 terms, there are more commuter or residential students, should you compare the mean or median?
Solution
Question 1
To find the mean number of commuter students in this class, we first add up the number of commuter students in all 4 terms:
8 + 17 + 14 + 17 = 56
Now we can find the mean by dividing the sum by the number of terms (4):
mean = [latex]\dfrac{56}{4}[/latex] = 14
Solution: In these 4 terms, the mean number of commuter students in this class was 14.
Question 2
To find the mean number of residential students in this class, we first add up the number of residential students in all 4 terms:
22 + 13 + 16 + 13 = 64
Now we can find the mean by dividing the sum by the number of terms (4):
mean = [latex]\dfrac{64}{4}[/latex] = 16
Solution: In these 4 terms, the mean number of residential students in this class was 16.
Question 3
To find the median number of commuter students, we first need to order the number of commuter students in all 4 terms:
8, 14, 17, 17
Solution: In these 4 terms, the median of commuter students in this class was 15.5.
Question 4
To find the median number of residential students, we first need to order the number of residential students in all 4 terms:
13, 13, 16, 22
There are two numbers in the middle: ‘13‘ and ‘16‘. The median is the mean of these two numbers: [latex]\dfrac{13+16}{2}[/latex] = 14.5.
Solution: In these 4 terms, the median of residential students in this class was 14.5.
Question 5
To compare the total number of commuter and residential students in all 4 terms, we should compare the mean. The median is not accurate because some numbers were not considered; as a comparison, each number is used when the mean is calculated.
The mean of residential students is bigger than that of commuter students, so more residential students attended this class in all four terms. Notice that the median of commuter students is actually bigger than that of residential students.
Don’t think that the median is not useful. When there are outliers (very big or small numbers compared to most numbers in the group), the median is better than mean. That’s why in newspapers, you will more than likely see “the median house price” than “the mean house price,” etc.
Correct Answers
- 14
- 16
- 15.5
- 14.5
- mean
Problem 2
The following diagram shows a boxplot for the lifetimes (in months) of a sample of 30 lightbulbs.
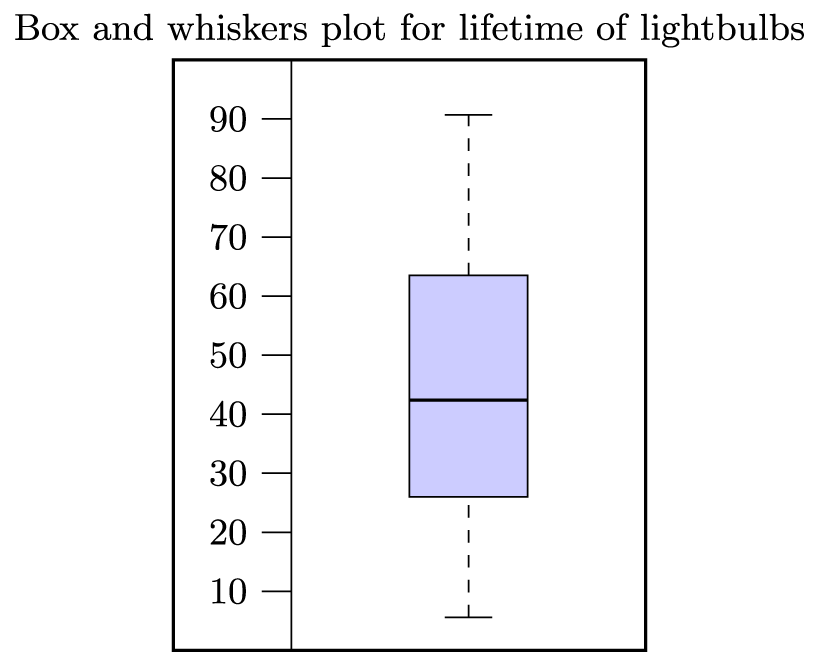
(a) What is the median lifetime?
- 5.6
- 26.0
- 42.4
- 63.5
- 90.7
(b) Which of the following statements is correct?
- The mean is larger in value than the median
- The mean is smaller in value than the median
- The mean is equal in value to the median
- There is insufficient information to make a comparison of the mean and median
Correct Answers
- 42.4
- The mean is larger than the median
