
1 An Overview of Statistics
Welcome to your first destination along the equity-mindfulness journey!
This first destination was designed to set the tone for you as a learning community member—introducing you to statistics by “data diving” into a real-world social justice issue in health care, specifically, the public health sector. You will be introduced to fundamental concepts, definitions, and terminology of statistics along your journey—still with equity embedded in each step and not a secondary consideration.
Before we start “data diving”, I want to share that statisticians have the coolest job! We can contribute to society in so many ways—from protecting endangered species and managing the impacts of climate change to making medicines more effective and reducing hunger and disease. This is because statistics is a science that involves asking questions about the world and finding answers to them in a scientific way.
Now, we are ready to begin, so please put on your metaphorical equity glasses as we discuss the following topics:
Learning Outcomes
- The Statistics-Data Alignment
- Data Equity
- Health Equity Framework
- Social Determinants of Health
- The World of Statistics: Basic Concepts and Terminologies
- Population (Parameter) vs. Sample (Statistics)
- Two Major Branches of Statistics: Descriptive and Inferential
- Data Classification: Quantitative and Qualitative Data
- Quantitative Variables in Community-Based Research
- Levels of Measurement
- Designing a Statistical Study
1.1 The Statistics-Data Alignment
Statistics is a branch of applied mathematics that involves the collection, description, and analysis of quantitative data. The relationship between data and statistics is a symbiotic one. Understanding data is impossible without statistics. Statistics presents a rigorous scientific method for gaining insight into data. Data and statistics are used side-by-side in this OER to better understand a variety of social justice issues, such as health disparities, incarceration, hunger, and food insecurity, income inequality (gender pay gaps and race), poverty, gun violence, racial injustice, gender identity/expression, gender-based violence, global climate change, reproductive rights, disparities in maternal and infant health, violence and discrimination experienced by LGBTQ+ people, and gaps in cultural wealth.
1.2. Data Equity at the Core of Health Outcomes
Statistical concepts and practices are best understood when applied to data. Even before this, we must think critically about how data is collected, analyzed, and interpreted for the betterment of an organization, community, or group of people. This is where data equity comes into play. According to Moser Technology, “Data equity frameworks apply an equity-centered lens and mindset to ensure data is collected, analyzed, interpreted, and shared with diverse stakeholders without bias or exclusion.” For example, if clinical trials on new medications are only performed on white males, females, and intersex, the final product might not prove to be effective for other racial and ethnic groups and could actually produce harmful side effects.
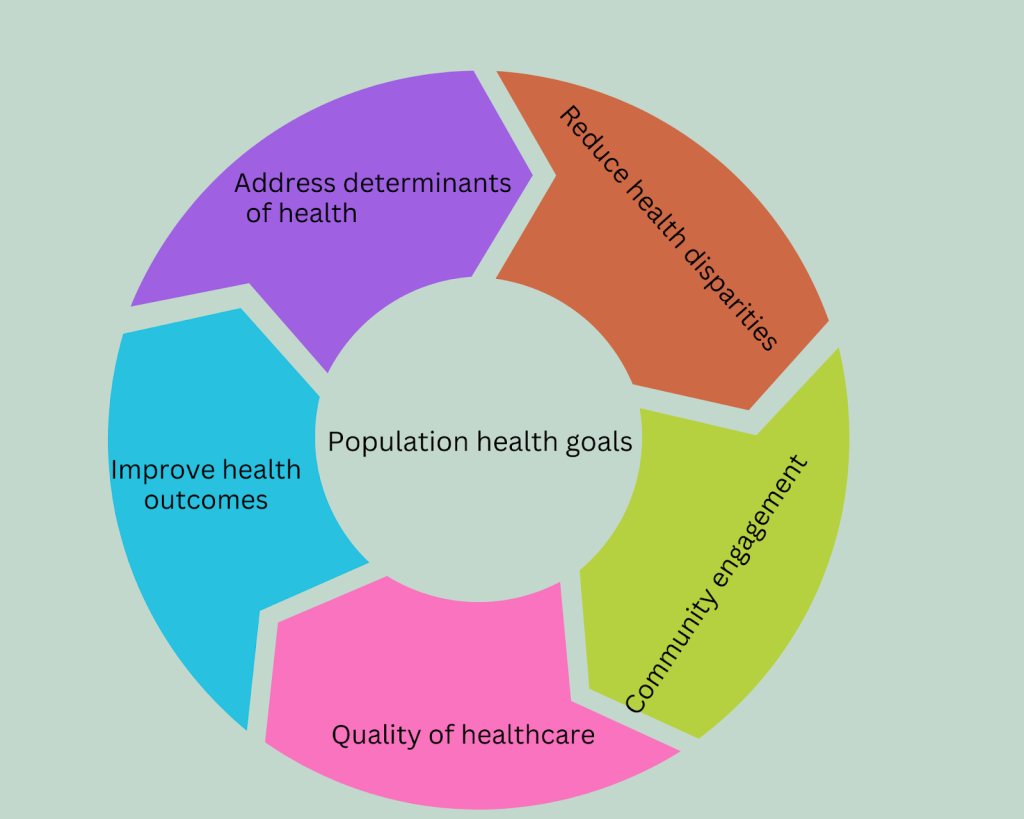
A population health equity framework aims to achieve optimal health for all by targeting social and structural determinants of health (Trinh-Shevrin et al. 2015)[1]. This framework is population-based, focusing on the entire population within the United States achieving optimal health. In theory, it moves towards the vision of improving total population health and reducing health inequities in underserved communities of color. However, in actuality, since strategies and interventions in research are conducted on majority dominant populations—largely white and middle class—they have made little impact on eliminating health disparities on a community level. In fact, gaps in health disparities have widened for people of color. People of color is a term used to refer to African Americans, American Indians/Alaskan Natives, Asian Americans, Latinos/Hispanics, and Native Hawaiians/Other Pacific Islanders. Systemic and structural racism consists of the systems and structures of a society that expose people of color to health-harming conditions and that impose and sustain barriers to opportunities that promote good health and well-being (Braveman et al. 2022)[2].
Contrasting the term population is sample—a subset, or part, of the population which is the whole (see Figure 1 below). An example is affluent suburban communities achieving optimal health outcomes.
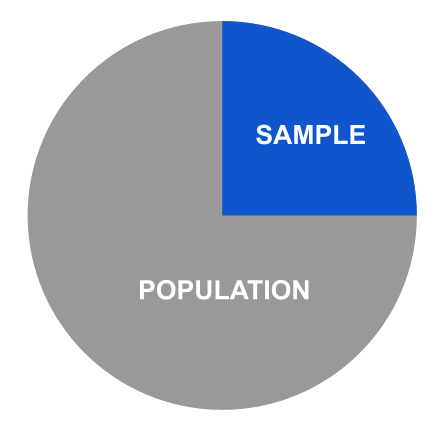
A parameter is a numerical description of a population statistic. A statistic is a numerical description of a sample characteristic.
Data Equity Example #1:
The City of Boston
According to the Boston Planning and Development Agency[3], in 2022, the total population of the city of Boston is 689,326, with a median household income of $76,298 (a parameter). The city of Boston comprises many Census Block Groups and Neighborhoods that can be described as subsets of the total population of Boston. Those neighborhoods with higher proportions of ethnic/racial groups are presented with their total populations respective median household incomes[4]: Chinatown (pop. 7,143; $32,735) Dorchester (pop.122,191; $59,379), Mattapan (pop.23,834; $58,633), Mission Hill (pop.17,886; $45,392), and Roxbury (pop.54,905; $33,322). Since these neighborhoods are subsets of the city of Boston, their median household incomes are considered a statistic, ranging from $32,735 to $59,379. This range is well below the median household income of $76,298 for the city of Boston’s total number of residents.
Now, let’s examine neighborhoods that have lower proportions of ethnic/racial groups and higher proportions of the White population. What are their median household incomes? A sample of these neighborhoods include Back Bay (pop.19,588; $111,141), Beacon Hill (pop.9,336; $116,505), East Boston (pop.43,066; $63,721), and South Boston (pop.37,917; $122,635). Their range of median household incomes is $63,721 to $122,635 and, for the most part, are higher than the incomes of Boston’s residents in total.
Discussion Questions: Wearing your equity lens as a statistician, what associations or correlations do you see in this example? What other data would you like to see to tell the story?
1.3. The Social Determinants of Health Approach
Different groups of people can have markedly different levels of health. The Social Determinants of Health approach asserts that the conditions in which people live, work, and play are primary drivers of one’s health status. Thus, one’s socioeconomic position–along with one’s ability to access housing, transportation, political environment, cultural beliefs, and norms, as well as experience with racism and discrimination—are factors that influence the health of a population or a community neighborhood. A person’s social determinants of health can contribute more to one’s health than genetic code or medical care.
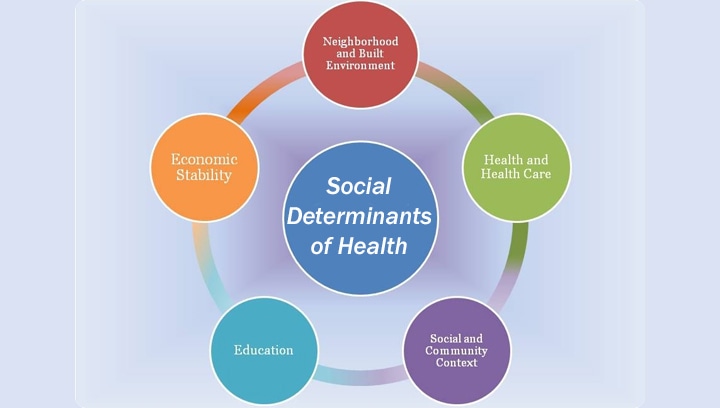
As part of its Health Equity Framework, the Boston Public Health Commission (BPHC) includes several factors when applying the Social Determinants of Health approach to city residents. These factors fall within three categories: economic, environmental, and social.
- Access to healthcare
- Access to health resources
- Access to healthy food
- Education
- Employment and occupational safety
- Environmental safety
- Exposure to violence
- Housing conditions
- Income
- Insurance coverage
- Racism and discrimination
- Transportation
BHPC assessment concludes that “many health-promoting resources, such as income, employment, education, and homeownership, are unevenly distributed within our city among those of differing races and ethnicities, socioeconomic statuses, and geographic locations.”[5]
Historically speaking, zip code data is the most widely used geographic data to help understand the needs of a population. The assumption is that it truly represents the community or neighborhood of interest. According to Health IT Analytics, “geographic data is most useful for identifying hot spot areas where the population is at high risk for contracting a disease or in high need of interventions to minimize disease impact. These are areas where the average income might be well below the federal poverty line.”
Data Equity Example #2:
Social Determinants of Health (Zip Codes)
For the city of Boston, residents living in zip codes representing the neighborhoods of Roxbury (02119), Mission Hill (02120), Dorchester (02121, 02124, 02125), and Mattapan (02126) have lower median household incomes compared to Boston overall[6]. They also have higher percentages of people living below the poverty line. Moreover, according to 2015 BPHC data, a higher percentage of Boston adult residents with incomes less than $25,000 have asthma, diabetes, hypertension, obesity, persistent anxiety, and persistent sadness compared with those with a household income of $50,000 or more.
Discussion Questions: Wearing your equity lens as a statistician, what associations or correlations do you see in this example? What other data would you like to see to tell the story?
1.4.(a) The World of Statistics: Basic Concepts and Terminology
1.4(a). Definition of Statistics
Welcome to the beautiful world of statistics! We live in a world of information where much of it is determined mathematically with the help of statistics. Statistics is the science of collecting, organizing, analyzing, and interpreting data in order to make decisions. As shown in the previous sections, there are two types of data sets you will use when studying statistics—population and samples. In statistics, population is the entire set of items (individuals, organizations, events, widgets, etc.) about whom you wish to draw conclusions. A sample is used to gain information about a population. An example of a population is the entire student body at a community college in Massachusetts. A sample is students who take an Introductory Statistics course in the evenings.
Samples are used by statisticians when the population is large and scattered or it is difficult to collect data at this level. Samples should be randomly selected and represent the entire population and every group within it. Statistical methods are used to collect random samples to reduce sampling bias and increase validity when answering research questions. Drawing inferences from samples to populations is referred to as decision-making in the data analysis stage of social research.[7]
A parameter is a numerical description of a population statistic. It is any summary number (e.g., the mean or percentage) that describes a population. A statistic is a numerical description of a sample characteristic. For example, the median household income in the United States is a population parameter. Conversely, the median household income for a sample drawn from the United States, such as the city of Philadelphia in Pennsylvania, is a sample statistic.
Study Tip: To remember the terms parameter and statistics, match the first letters of population parameter and the first letters in sample statistics.
1.4(b). Two Major Branches of Statistics
Descriptive statistics summarizes the characteristics of a data set. Inferential statistics uses a sample to draw conclusions about the population. You test a hypothesis or assess whether the data is generalizable to the population. Know that you can never be 100% sure about inferences. A major theme of this OER is how to use sample statistics to make inferences about unknown population parameters.
Now Try It Yourself
1.4(c). Data Classification: Quantitative and Qualitative Variables
A prerequisite for exploring data more deeply is coming to grips with the different types of data you can encounter. A research study can consist of two types of data: quantitative and qualitative. Quantitative data is data about numerical variables (e.g., how many, how much, or how often) that are measurements or counts. Qualitative data is data about non-numerical variables (e.g., what type) that are attributes or labels.
Quantitative Variables in Community-Based Research
Variables are elements, entities, or factors that can change under different conditions or circumstances for different people. Statisticians are often interested in demographic variables when trying to understand the characteristics or attributes of a community or neighborhood. Examples are:
- Population Size
- Age
- Race/Ethnicity
- Gender
- Educational Attainment
- Marital Status
- Average or Median Income
- Employment Status
- Home Ownership vs. Renting
- Access to Public Transportation
- Access to Healthy and Affordable Food
1.4(d). Levels of Measurement
Another characteristic of data is its level of measurement. It is the first or perhaps the most important piece of descriptive information about a research variable. There are four hierarchical levels of measurement (lowest to highest): nominal (qualitative data), ordinal (qualitative or quantitative data), interval (quantitative), and ratio (quantitative).
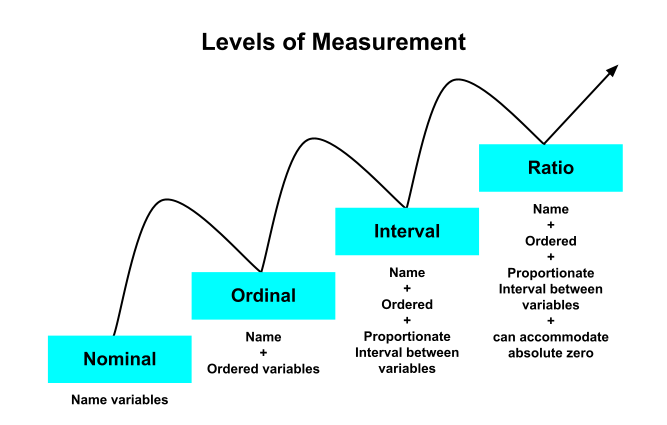
The word “nominal” means name. A nominal level of measurement names the attribute, characteristic, or identity we are interested in, has no numerical value and is not rank ordered. Examples of nominal variables in social science research are race, gender, marital status, religious affiliation, and voting behavior. Measurement of the quality of pain is a nominal variable. Pain might be throbbing, constant, dull, sharp, stinging, achy, or burning.[8] It may surprise you that zip code is a nominal variable. A categorical variable (sometimes called a nominal variable) is one that has two or more categories, but there is no intrinsic ordering to the categories. For example, there is no implied order or hierarchy to the categories “Hispanic or Latino” and “Not Hispanic or Latino”.
An ordinal level of measurement includes a rank ordering of variable values, such as being greater than or less than, making them more complex than nominal variables. In ordinal measurement, the numbers represent categories, but they function much more like labels. Likert scales are often used to represent ordinal data: strongly disagree, disagree, neither agree nor disagree, agree, strongly agree. Ordinal scales do not have equal intervals. Thus, the difference between 1 and 2 may not be the same as that between 3 and 4. Socioeconomic standing is an ordinal variable: lower, middle, and upper class. Another example is the performance of a government policy on a social justice issue: superior, effective, minimal, or inadequate. Qualitative or quantitative data can have an ordinal level of measurement.
The interval level of measurement is continuous, can be rank ordered, exhaustive (all possible attributes are listed), and mutually exclusive (a person cannot identify with two different attributes simultaneously). The intervals are equal; there is no absolute zero. The attributes are numbers rather than categories. IQ scores are interval level, and so is temperature. Only quantitative data can have an interval level of measurement.
The ratio level of measurement is the highest of the four hierarchical levels of measurement. Quantitative data, such as age, income, unemployment rate, the rate of infant mortality in a particular country, or recidivism rate (reoffending and reentering the prison system) are examples of ratio variables. Unlike interval data, a distinguishing part of ratio data is that it has a “true zero”. This basically means that zero is an absolute with no meaningful values below it, such as a negative number. Age is a good example—you cannot be -25 years old.
Oftentimes, ratio data is the most desirable type of data since it can perform the widest possible range of analyses, improving our ability to test hypotheses with more accurate insights. Many variables in the social sciences have ratio scales. Like interval variables, ratio-scaled variables can be discrete (expressed only in countable numbers) or continuous (can potentially take on an infinite number of values. You count discrete variables, and the results are integers, such as the number of residents in a neighborhood who are immigrants. On the other hand, if you measure continuous variables—they can take on any numeric value, including fractional and decimal values. Both types of variables are essential in statistics.
Now Try It Yourself
1.5 Designing a Statistical Study
1.5(a) Purpose of the Study
A statistical study has purpose, scope, and direction, namely, why the study is being conducted. The goal of the study might be to describe a concept, predict a situation, or examine the magnitude (strength) and direction (positive or negative/inverse) of the relationship between certain variables (e.g., race/ethnicity and health outcomes). The purpose statement identifies the variables of the study. For example, the purpose of this study is to “examine the characteristics and attributes of single mothers who are first-generation college-bound, their study habits, and work commitments in relation to quality time spent with their child(ren).”
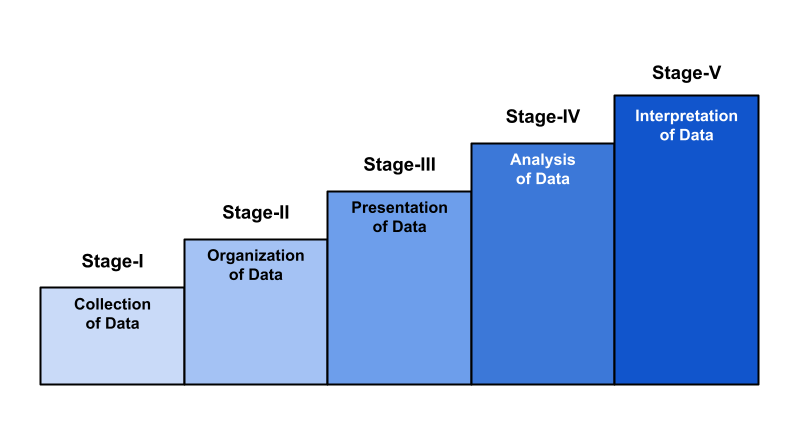
After the variables of interest have been identified, Larson & Farber (2019)[9] suggest five sequential steps to be followed:
- Develop a detailed plan for collecting data. Make sure the sample is representative of the population.
- Collect the data.
- Describe the data using descriptive statistical techniques.
- Interpret the data and make decisions about the population using inferential statistics.
- Identify any possible errors.
1.5(b) Choosing a Sample Size
When conducting a study, choosing the correct sample size can have a huge impact on the results since sample data can help approximate findings about a population. The fundamental question is, “What sample size do I need for successful inference?” The steps for calculating a sample size are:
- Determine the population size, which is the total number of the target demographic.
- Decide on a margin of error. This is the difference you will allow between the sample mean (or average) and the mean of the total population.
- Choose a confidence level that indicates how assured you are that the actual mean will fall within your chosen margin of error. Most statisticians choose confidence levels that are 90%, 95%, or 99% confident.
- Pick a standard of deviation or the level of variance you are expecting in the information gathered. Choosing 0.5 is typically a safe choice that will ensure a large enough sample.
- Complete the calculation. The sample size formula helps calculate or determine the minimum sample size.
Sample Size [latex]n = \frac{N*[Z2 * p * \frac{(1-p)}{e2}]}{N-1(Z2 * p * \frac{(1-p)}{e2}]}[/latex] where,
- N = Population Size
- Z = Critical Value of the Normal Distribution at the Required Confidence Level
- p = Sample Proportion
- e = Margin of Error
1.5(c) Sampling Techniques
Appropriate sampling techniques are used to ensure that inferences about the population are valid. A sampling design describes exactly how to choose a sample from a population. Probability sampling is a sampling technique which chooses samples from a larger population using a method based on the theory of probability. For example, in a population of 500 members, every member will have 1/500 chance of being selected to be a part of the sample.
The most important condition for sound conclusions from statistical inference is that the data is a random sample from the population of interest. A simple random sample is a likelihood of being selected. Consider a study of the number of people who live in the poor and working-class urban community of North Philadelphia (Philly), Pennsylvania.[10]

To use a simple random sample to count the number of people who live in North Philly’s households, you can assign a different number to each household, use a table of random numbers to generate a sample of numbers, and then count the number of people living in each selected household.
When it is important for the sample to have members from each segment of the population, then you will use a stratified sample. It selects a sample of members from all strata. For instance, to make a stratified sample of the number of people who live in North Philly, you can divide the households into socioeconomic levels and then randomly select households from each level. If 70% of the people in North Philly belong to the low-income group, then the proportion of the sample should have been 70% for this group.
In systematic sampling, each member of the population is assigned a number. To collect a systematic sampling in North Philly, a different number can be assigned to each household, randomly choose a starting number, select every 25th household, and count the number of people living in each household. Cluster sampling uses all members from a randomly selected sample of clusters (but not all, some clusters will not be part of the sample). For instance, to collect a cluster sample of the number of people who live in North Philly households, divide the households into groups according to zip codes. Then, select all of the households in one or more, but not all, zip codes and count the number of people living in each household.
Now Try It Yourself
The American Statistical Association (ASA) has a minority membership directory that is accessible to the public. The ASA defines “minority” as being of Spanish/Hispanic/Latino ethnicity or having a race other than white. You are a new Statistician who is interested in learning about members’ experiences while working in a predominantly white profession.
Discussion Questions: What questions would you ask? How would you go about implementing this study? What specific steps would you take in securing their opinions? What information (or assumptions) do you need to know (or make) to get started?
Conclusion:
Reflective Essay

Chapter 1: Summary
In this Chapter, you were introduced to several new concepts and terminologies fundamental to statistics. You learned that statistics, statistical practice, and data—all three can speak together on issues of social justice and equity. The compassion of statistics is best summed by MacGillivray (2021), “statistics is one of the most unselfish sciences” and “improves human welfare not by its own ends, but by its contributions in all fields.”[11]
To continue your journey in learning statistics from a data-equity perspective, Chapter 2 will help you to acquire basic data literacy skills. Data literacy can be seen as competence in making sense of data, including the interpretation and presentation of data—numerically [quantitative] or non-numerically [qualitative]. By learning how to categorize and summarize data, we are in a better position to identify and answer critical questions concerning equity-minded issues: a global focus in the “ecosystem of policymaking”.
From a technical perspective, in Chapter 2, you will learn ways to organize and describe data sets, such as through graphs and numeric measures. The following three measures will be discussed in Chapter 2:
- Measures of central tendency (mean, median, and mode).
- Measures of dispersion (range, interquartile range, variance, and standard deviation).
- Measures of position (decile, percentile, and quartile).
My personal viewpoint is that building and sustaining a healthy culture of inquiry, especially one that considers evidence of equity or inequity, is an attribute of a culturally responsive statistician.
Enjoy the journey with your favorite beverage!
- Trinh-Shevrin C, Nadkarni S, Park R, Islam N, and Kwon S (2015). Defining an integrative approach for health promotion and disease prevention: A population health equity framework. J Health Care Poor Underserved, 2015 May; 26 (2 0): 146-163. ↵
- Braveman PA, Arkin E, Proctor D, Kauh T, & Holm N (2022). Systemic and Structural Racism: Definitions, Examples, Health Damages, and Approaches to Dismantling. Health Affairs, Vol 41, No. 2: Racism and Health. ↵
- Boston Planning and Redevelopment Authority (2022). Research Publications: Boston At a Glance 2022. Note: Based on the 2016-2020 American Community Survey. ↵
- Boston Planning and Redevelopment Authority. Research Publications: Boston in Context-Neighborhoods. Note: Based on 2020 Decennial Census Redistricting Data and the 2016-2020 American Community Survey. ↵
- Boston Public Health Commission (2022). Health of Boston Reports. Chapter 2: Social Determinants of Health, page 108. ↵
- Ibid, page 136. ↵
- Levin J & Fox JA (2006). Elementary Statistics in Social Research. Boston, MA: Pearson Education, Inc. ↵
- McHugh, ML (2003). Descriptive Statistics, Part I: Levels of Measurement. JSPN, Vol. 8, No. 1, January-March 2003. ↵
- Larson R & Farber B (2019). Elementary Statistics: Picturing the World. Boston, MA: Pearson Education, Inc. ↵
- The author was born and raised in North Philly which continues to be highly segregated with predominantly Black populations living to the west of Broad Street and predominantly Hispanic populations to the east of 5th avenue. Overall, the city of Philadelphia has a high poverty rate of 23% (2019-2020), and has been described as the poorest big city in America. The economic disruptions of the COVID pandemic have hurt people of color living in Philly in large proportions. ↵
- MacGillivray, H (2021). Editorial: Statistics and data science must speak together. ↵
