
4 Inferential Statistics: Sampling Methods
Learning Outcomes
- Sampling Methods
- Sampling Error
- Sampling Distribution of Sample Means
- The Central Limit Theorem
- Sampling Variability
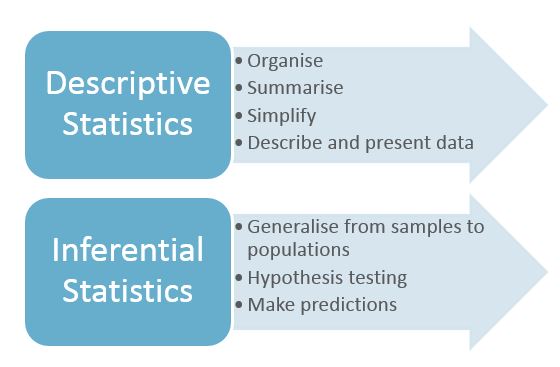
Descriptive statistics describes a sample, using summary statistics and graphs to present the group properties. Chapters 1 and 2 discussed the three major types of descriptive statistics: frequency distribution, central tendency, and variability/dispersion. With descriptive statistics there is no uncertainty as you are summarizing the characteristics of a data set. Measures of central tendency (mean, median, and mode) and measures of dispersion or variation (range, interquartile range, variance, and standard deviation) are used to understand descriptive statistical results.
Steps for Describing Descriptive Statistics Results
- Describe the sample based on demographics of interest, such as, race/ethnicity, gender, age, zip code, education, etc.
- Describe the center of the data.
- Describe the spread and shape of the data distribution.
- Describe the data using tables, charts, and graphs to summarize the frequency of values of variables, rendered in percentages or numbers.
- Describe the data using univariate descriptive statistics (examining one variable at a time) or bivariate descriptive statistics (two variables are analyzed or compared concurrently) to see if they are correlated.
In chapter 3 on probability, you were introduced to another branch of Statistics—inferential statistics. Descriptive statistics are used to effectively summarize and describe the main features of a data set, while statistical inferential methods make predictions or inferences about a larger population which goes beyond descriptive statistics involving estimating parameters and testing hypotheses.
Probability is the underlying concept of inferential statistics and forms a direct link between a sample and the population it comes from. A random sample of data from a portion of the population is used to make inferences or generalizations about the entire population. For example, Wooditch et al. (2021)[1] reports that there are “many topics within criminology and criminal justice research where conclusions are drawn from data that are generalizable to wider populations.”
Inferential statistics plays an important role in fields such as science, medicine, social science, and business. These are fields that also have a greater opportunity to adopt social justice principles: access, equity, participation, and human rights. Social equity includes equal opportunities and obligations and, therefore, involves the whole of society. It is about access, mutuality, and concern for justice and fairness in social policy.[2] Social equity negates discrimination on the basis of race, gender, sexual orientation, class, income, language, religion, convictions, opinions, or disabilities (Augusty & Dizon 2020)[3].
Social equity, in the context of statistics, uses information and data to provide opportunities for success to individuals based on their right of access and specific needs. Some statisticians, therefore, add social group dimensions (variables) to data collection such as race and gender, whereas others may also include qualitative stories, life experiences, and realities of indigenous lives to contextualize the quantitative data, promoting social equity. Like the author, they passionately believe that the invisibility of vulnerable groups in data collection results in the marginalization of groups. This OER book intentionally puts a “spotlight” on historically marginalized individuals, families, groups, and communities not only because it is morally right but also because not to do so is flawed analysis.
For the author, adopting a social justice framework to statistics starts with seeing all students as capable of learning statistics and transforming into “statistically literate citizens” who can identify and help solve equity-related problems for families and communities. This includes using data to capture the magnitude of inequities and to track the progress of equity over time.
Social equity involves the analysis of different subgroups (i.e., the sample) relative to a majority group (i.e., the population). This chapter discusses various methods that can be applied during this inferential statistical process. Specific topics on sampling will be covered in this chapter:
- Sampling Methods
- Sampling Error
- Sampling Distribution of Sample Means
- The Central Limit Theorem
4.1 Sampling Methods
The purpose of a sample is to give information about a larger population. The process of drawing conclusions about a population on the basis of sample data is called inference. To make inferences, you have to select an appropriate sampling method. Sampling is a technique of selecting individual members or a subset of the population to make statistical inferences to estimate characteristics of the whole population. Sampling design describes exactly how to choose a sample from a population.
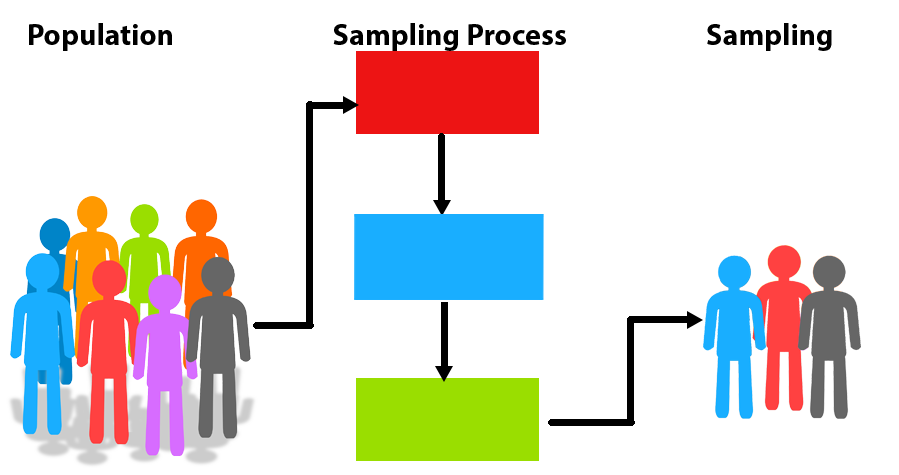
The first question to ask about a sample is whether it was chosen at random. Moore, Notz & Fligner (2013)[4] provides two reasons to choose random sampling. The first reason is to eliminate bias in selecting samples from the list of available individuals. The second reason to use random sampling is that the laws of probability allow trustworthy inference about the population.
If every population member is given an equal chance of sample selection, a random sampling method is used. This is known as probability sampling. Otherwise, a nonrandom or sampling with non-probability is employed.
In probability sampling, a total sample has an equal chance of being chosen. The probability is that each segment of the population has a probability of being selected and gives the likelihood of the sample being representative of the population. There are four types of probability sampling techniques:
4.1(a). Simple Random Sampling (SRS)
Simple Random Sampling (SRS): a reliable method of obtaining information where every single member of a population is chosen randomly, merely by chance. Each person has the same probability of being chosen to be a part of a sample. An SRS of size n individuals from the population is chosen in such a way that every set of n individuals has an equal chance to be the sample actually selected. A specific advantage of simple random sampling is that it is the most straightforward method of probability sampling. A disadvantage is that you may not find enough individuals with your characteristic of interest, especially if that characteristic is uncommon.
4.1(b). Cluster Sampling
Cluster Sampling: a method where statisticians divide the entire population into clusters or sections representing a population. Demographic characteristics, such as race/ethnicity, gender, age, and zip code can be used to identify a cluster. Cluster sampling can be more efficient than simple random sampling, especially where a study takes place over a wide geographic region.
An extended version of cluster sampling is multi-stage sampling, where, in the first stage, the population is divided into clusters, and clusters are selected. At each subsequent stage, the selected clusters are further divided into smaller clusters. The process is completed until you get to the last step, where some members of each cluster are selected for the sample. Multi-stage sampling involves a combination of cluster and stratified sampling.
The U.S. Census Bureau uses multistage sampling by first taking a simple random sample of counties in each state, then taking another simple random sample of households in each county and collecting data on those households.
An Example of a Multi-Stage Cluster Sampling:
Applying the Equity Lens
The National Survey of American Life (NSAL) is the most comprehensive and detailed study of mental disorders and the mental health of Americans of African descent. The study was conducted by the Program for Research on Black Americans (PRBA) within the Institute for Social Research at the University of Michigan.[5] According to Jackson et al. (2004), the study includes “a large, nationally representative sample of African Americans, permitting an examination of the heterogeneity of experience across groups within this segment of the Black American population. Most prior research on Black Americans mental health has lacked adequate sample sizes to systematically address this within-race variation.”
Special emphasis of the study is given to the nature of race and ethnicity within the Black population by selecting and interviewing national samples of African American (N=3,570) and Afro-Caribbean (N=1,623) immigrants, and second and older generation populations. National multi-stage probability methods were used in generating the samples and race/ethnic matching of interviewers and respondents were used in the face-to-face interview, which lasted on average 2 hours and 20 minutes. For generalizability, probability sampling methods were used in the study for stronger statistical inferences.
4.1(c). Systematic Sampling
Systematic Sampling: a method where sample members of a population are chosen at regular intervals. It requires selecting a starting point for the sample and where sample size determination can be repeated at regular intervals. Systematic sampling is often more convenient than simple random sampling as it is easy to administer.
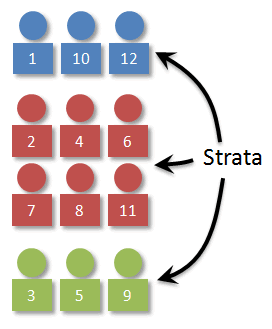
4.1(d). Stratified Random Sampling
Stratified Random Sampling: a method that divides the target population into smaller groups that do not overlap but represent the entire population. The selected sample from different strata is combined to have a single sample.
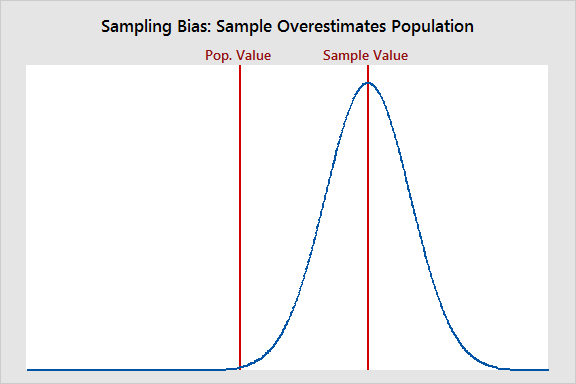
Stratified sampling improves the accuracy and representativeness of the results by reducing sampling bias (where some members of a population are systematically more likely to be selected in a sample than others). The design of a statistical study is biased if it systematically favors certain outcomes.
Statistical bias refers to measurement or sampling errors that are systematic and produced by the measurement or sampling process. An important distinction is made between errors due to random chance and errors due to bias. An unbiased process will produce error, but it is random and does not tend strongly in any direction.

Figure 2 shows how sampling bias can result in the sample mean overestimating (or underestimating) the population mean.
In sampling with non-probability, non-randomized methods are used. Participants are chosen since they are easy to access in place of randomization. The limitation of this method is that the results are not generalizable to the population but are relevant primarily to that particular group sampled.
There are two stratified sampling techniques. The proportionate sampling of stratified samples is used when the number of elements assigned to the different strata is proportional to the representation of the strata in the target population (Illiyasu & Etikan 2021)[6]. The disproportionate sampling of stratified samples is used when the number of elements sampled from each stratum is disproportional to their population representation (Illiyasu & Etikan 2021).
Now Try It Yourself
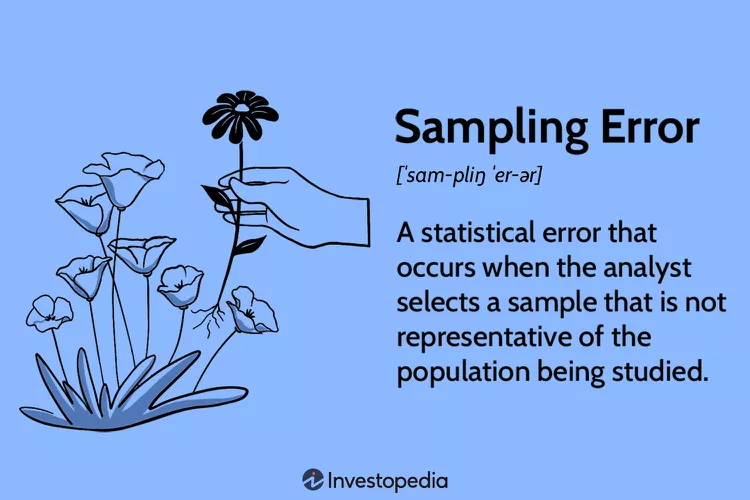
4.2 Sampling Error
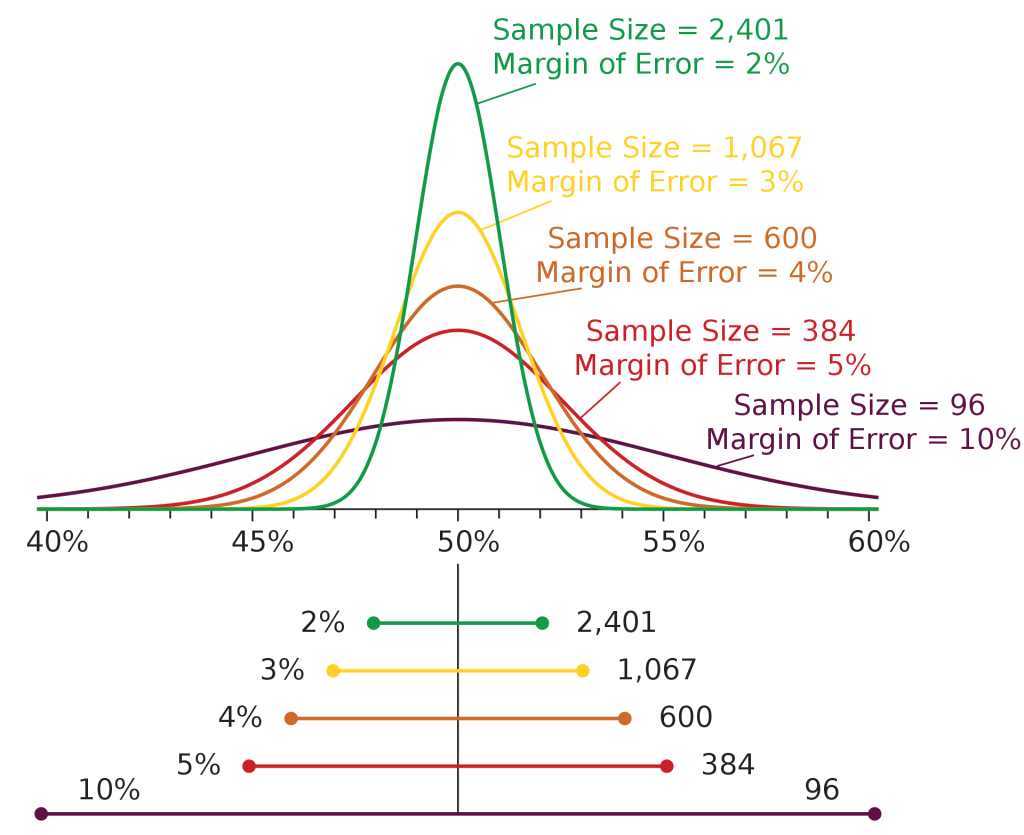
You are more familiar with the concept of sampling error than you realize. Recall that election polls, for example, typically generalize from a small sample to the entire population of voters. When reporting the results, the margin of error is typically provided by the market research industry for data reliability. As a hypothetical example, we might hear that Michelle Obama is receiving 70% of the vote as a presidential candidate, with a ±4% margin of error. In other words, there is confidence that somewhere between 66% (70%-4%) and 74% (70%+4%) will go Michelle’s way. The reason an exact percentage vote cannot be provided is due to uncertainty which, in turn, is due to the effect of sampling error.
The margin of error is a statistic expressing the amount of random sampling errors in the results of a survey. The larger the margin of error, the less confidence one should have that a poll result would reflect the result of a census of the entire population. The margin of error will be positive whenever a population is incompletely sampled and the outcome measure has a positive variance.
As shown in Figure 3 below, in general, the sampling error (or margin of error) gets smaller as the sample size increases because the sample more accurately represents the population. Furthermore, along with increasing the sample size, sampling errors can be controlled if the sample is chosen at random from the population. Another way to look at it is through the law of large numbers, which states that the actually observed mean outcome [latex]\bar{x}[/latex] must approach the mean µ of the population as the number of observations increases.
The Impact of Sampling Error in the Restructuring of Ecological Community Relationships:
Applying an Equity Lens
Hirst & Jackson (2007)[7] report in their study that the structure of an ecological community is affected by how many species are present, their relative abundance, and how broadly each component species is distributed along environmental gradients. These differences in structure among sites provide the basic information used in community analysis. Ecologists often are confronted with various sources of error and complications in being able to adequately summarize patterns of species composition and the resemblance of sampling locations to one another. There are a variety of problems inherent in sampling ecological populations and communities. Specific problems include the low prevalence or the low numbers of rare species, the habitat or season when sampling is done, how representative samples are, choices in the type of sampling methodology, intrinsic variability in each species distribution, and methods of data analysis that effectively summarize patterns in species composition and site resemblance. As one might expect, study results showed that lower levels of sampling error tend to produce more accurate, less distorted results overall.
Now Try It Yourself
4.2(a) Sampling Distribution of Sample Means
Given the presence of sampling error, one may wonder if it is ever possible to generalize from a sample to a larger population. The theoretical model known as the sampling distribution of means has certain properties that give it an important role in the sampling process. Levin and Fox 2006[8] point out these characteristics:
- The sampling distribution of means approximates a normal curve. The sampling distribution of means is the probability distribution of a sample statistic that is formed when random samples of size n are repeatedly taken from a population (Larson & Farber 2019)[9]. If the raw data are normally distributed, then the distribution of sample means is normal regardless of sample size. Every sample statistic has a sampling distribution.
- The mean of a sampling distribution of means (the mean of means) is equal to the true population mean. They are regarded as interchangeable values.
- The standard deviation of a sampling distribution of means is smaller than the standard deviation of the population. The standard deviation of the sampling distribution of the sample means is called the standard error of the mean (SEM). The sample mean is more stable than the scores that it comprises. A concrete example is taking your blood pressure rate each day using a digital instrument that is sensitive to which arm is used, the time of day, whether you are rushing to work, whether you are waiting to see your doctor (White Coat Syndrome)[10], etc. The best approach to determining your blood pressure rate, therefore, might be to take it every day for a week at different times and then take the mean. This characteristic is at the core of making reliable inferences from sample to population.
A high standard error shows that sample means are widely spread around the population mean, so your sample may not closely represent your population. A low standard error shows that sample means are closely distributed around the population mean, which means that your sample is representative of your population. You can decrease standard error by increasing the sample size. The formula for the standard error of the mean is expressed as:
[latex]SE=\frac{\sigma}{\sqrt{n}}[/latex]
Study Tip: The standard deviation and standard error are often confused. The standard deviation measures the variability of individual data points, and the standard error measures the variability of a sample metric. The Bootstrap (sampling with replacement from a data set) is a powerful tool for assessing the variability of a sample statistic. Bootstrapping is a statistical procedure that resamples a single dataset to create many simulated samples. This method takes the sample data that a study obtains and then resamples it over and over to create many simulated samples. Each of these simulated samples has its own properties, such as the mean. When you graph the distribution of these means on a histogram, you can observe the sampling distribution of the means. This process allows you to calculate standard errors, construct confidence intervals, and perform hypothesis testing for numerous types of sample statistics.
Now Try It Yourself
4.2(b). The Central Limit Theorem
The Central Limit Theorem forms the foundation for the inferential branch of statistics. This theorem describes the relationship between the sampling distribution of sample means and the population that the samples are derived from. Larson & Farber (2019) describes the Central Limit Theorem as:
- If random samples of size n, where n ≥ 30, are drawn from any population with a mean µ and a standard deviation σ, then the sampling distribution of sample means approximates a normal distribution. The greater the sample size, the better the approximation.
- If random samples of size n are drawn from a population that is normally distributed, then the sampling distribution of sample means is normally distributed for any sample size n.
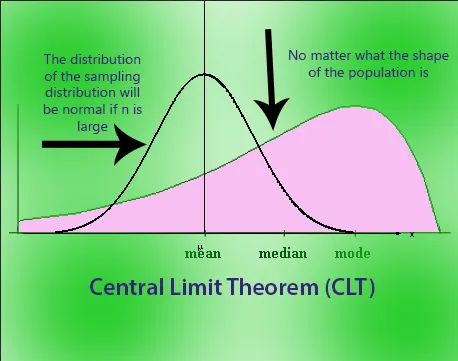
The Central Limit Theorem is useful when analyzing large data sets, as in criminal justice research, because it allows a statistician to assume that the sampling distribution of the mean will be normally distributed in most cases. This allows for easier statistical analysis and inference. Some statisticians view the Theorem as the cornerstone of modern statistics (Kwak & Kim 2017)[11].
Now Try It Yourself
Chapter 4: Summary
Studies are conducted on samples and not the entire population, given the practicalities involved. Sampling design or methods play an important role in helping ensure that sample results are accurate and can be generalizable to the population. The sample itself, therefore, must be adequate to represent the population. Quantitative sampling depends on two elements: random sampling and the sample size (power analysis [12]). Random sampling is required to ensure that there is no bias and that the entire sample is representative of the population. Power analysis is applied to determine the minimum sample size necessary to ensure that the data and sample are statistically significant.
The increasing volume of research studies often leads, in general, to increasing numbers of contradictory findings and conclusions. Although the differences observed may represent true differences, the results also may differ because of sampling variability, as some studies are performed on a limited number of participants. The LGBT Foundation’s website[13] is highlighted as an example of being intentional in recruiting targeted participants for a multitude of research studies. Obviously, the Foundation prioritizes having members of the LGBT community heard in research studies, which in turn, underscores the importance of having a proper sample size that represents the entire LGBT population. The website states:
“There is a great deal of interesting and important research on LGBT communities being carried out at the moment, much of this research relies on LGBT people getting involved and sharing their experiences. If you are LGBT and would like to have your voice heard by participating in ongoing research, see below for projects you can get involved in.
- Ethnic and Sexual Minority Health Project
- Difficulties in Male Same-Sex Relationships
- Exploring the Variable Effects of Social Media Use on Mental Health Outcomes,
- Including Minority Stress
- Exploring the Intersection Between Bisexuality, Dementia and Adult Social Care
- LGBT+ Public Transport Experience Survey
- Exploring Gay Men’s Experiences of Social Support, Relationships, and Difficult Emotions
- Supporting Access to Sexual Healthcare and Consultations: A Research Study
- Understanding the Paradigm Shift of Stereotyping and Conformity of Homosexuality in a UK Population: A Mixed Methods Exploration
- Experiences of Older LGBT People Using Community-Based Social Care Services, Groups and Activities
- Wooditch A, Johnson NJ, Solymosi R, Ariza JM & Langton, S. (2021). Inferential Statistics. In: A Beginner’s Guide to Statistics for Criminology and Criminal Justice Using R. Springer, Cham. ↵
- The author received her PhD from the Heller School for Social Policy and Management at Brandeis University, Waltham, MA. The Heller School is home to 11 Research Institutes: Schneider Institutes for Health Policy; Institute for Healthcare Systems; Institute for Behavioral Health; Institute for Global Health and Development; Institute on Assets and Social Policy; Institute for Child, Youth and Family Policy; Center for Youth and Communities; Lurie Institute for Disability Policy; Sillerman Center for Advancement of Philanthropy; Center for Global Development and Sustainability; and the Relational Coordination Research Collaborative. ↵
- Augusty MK & Dizon JT (2020). The Role of Community-Based Organizations in Addressing Social Equity Among Deprived Sections in the Conflict Vulnerable Areas in Karnataka, India. Asian Research Journal of Arts & Social Sciences, 11(1): 24-41, 2020; Article No.ARJASS.56850 ↵
- Moore DS, Notz WI, & Fligner, MA (2013). Essential Statistics: Second Edition. W.H. Freeman and Company: New York. ↵
- Jackson JS, Torres M, Caldwell CH, Neighbors HW, Nesse RM, Taylor RJ, Trierweiler SJ, & Williams DR (2004). The National Survey of American Life: A Study of Racial, Ethnic and Cultural Influences on Mental Disorders and Mental Health. International Journal of Methods in Psychiatric Research, Volume 13, Number 4. ↵
- Illiyasu R & Etikan I (2021). Comparison of Quota Sampling and Stratified Random Sampling. International Journal of Biometrics. https://www.researchgate.net/publication/354054682 . Retrieved on June 16, 2023. ↵
- Hirst CN & Jackson DA (2007). Restructuring Community Relationships: The Impact of Sampling Error, Ordination Approach, and Gradient Length. Diversity and Distributions, 13, 361-371. ↵
- Levin J & Fox JA (2006). Elementary Statistics in Social Research. Boston, MA: Pearson Education, Inc. ↵
- Larson R & Farber B (2019). Elementary Statistics. Boston, MA: Pearson Education, Inc. ↵
- White coat syndrome, or white coat hypertension, is the term to describe when you get a high blood pressure reading in a doctor's office and a normal reading at home. The anxiety of being around doctors in white coats can make your blood pressure rise (Cleveland Clinic). It always happens to me, so no need to do random sampling to assess its occurrence! ↵
- Kwak SG & Kim JH (2017). Central Limit Theorem: The Cornerstone of Modern Statistics. Korean Journal Anesthesiology, April; 70(2): 144-156. ↵
- Power analysis helps the statistician or researcher to determine the smallest sample size that is suitable to detect the effect of a given test at a desired level of significance. ↵
- Source: https://lgbt.foundation/research/participate. Retrieved on July 2, 2023. ↵
