
50% recombination frequency is the max, but chromosomes are longer than 50 map units
Mapping with a two-point testcross is most accurate for genes that are close together. The further apart they are, the less reliable the distance. This is for at least two reasons: first, the maximum recombination frequency is 50%, and second, more than one crossover event can occur between two genes.
Why is 50% recombination frequency the max? Remember, for independently assorting genes, testcrossing a dihybrid gives a 1:1:1:1 ratio of phenotypes among the offspring. Two of those classes are always parental and two are always recombinant, so a 1:1:1:1 ratio gives a 50% recombination frequency.
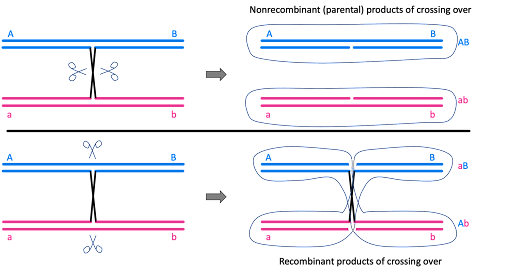
But why? It goes back to the mechanism of crossing over during meiosis. When crossovers form, they do not always generate recombinant products. The crossovers may be resolved, or cut apart, by separating the chromosomes back into their original conformation. Or, they can be cut apart generating recombinant products. This is shown in Figure 11. This happens randomly, so about 50% of crossovers are resolved non-recombinantly, restoring the parental chromosome.
Although the recombination frequency maxes out at 50%, genes can be much farther apart than 50 map units. To get around this experimental limitation, maps are typically constructed by compiling evidence from multiple pair-wise recombination frequencies. For example, for three genes Q, R, and S, we might see the following recombination frequencies:

| Gene pair | Recombination frequency |
| Q and R | 5% |
| R and S | 10% |
| S and Q | 15% |
This indicates that Q and R are 5 map units apart, R and S are 10, and S and T are 15 map units apart. We can draw the map in Figure 12.
One of the tricky things for this, though, is that it might appear that genes are unlinked, with a 50% recombination frequency. But that doesn’t mean that the map distance is 50 map units! The example in Table 4 and Figure 13 illustrate this.

| Gene pair | Recombination frequency |
| T and U | 50% |
| U and V | 30% |
| V and T | 40% |
In Table 4 and Figure 13, it might be tempting to say that T and U are 50 map units apart. But that is not correct – a 50% recombination frequency means the genes are unlinked, either on two different chromosomes or far apart on the same chromosome. And the data for U and V, and V and T, tells us that T and U are far apart on the same chromosome (about 70 map units, since 30 + 40 = 70). Always use the shortest “steps” to construct a map.
Test Your Understanding
Draw a chromosome map for genes L, M, and N.
| Gene pair | Recombination frequency |
| L and M | 50% |
| M and N | 35% |
| N and L | 25% |
While the specific examples given in this section describe two-point test crosses in fruit flies, the same principles were historically used to map genes in other organisms as well.
Media Attributions
- Cutting the chromatids © Amanda Simons is licensed under a CC BY-SA (Attribution ShareAlike) license
- Figure 12 © Amanda Simons is licensed under a CC BY-SA (Attribution ShareAlike) license
- Figure 13 © Amanda Simons is licensed under a CC BY-SA (Attribution ShareAlike) license
