
Calculating map distances with a dihybrid testcross
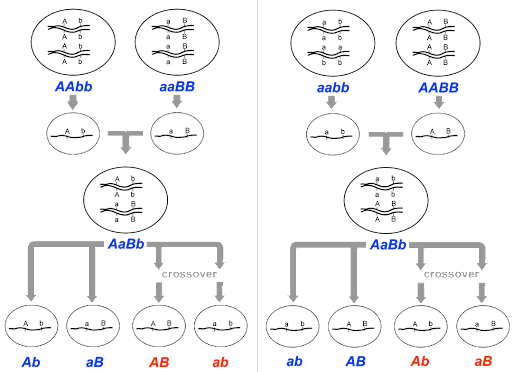
Morgan’s mapping experiments typically began with a cross between true-breeding individuals with two different mutant traits, like that shown in Figure 8.
In Figure 8, an AAbb parent meiocyte produces Ab gametes, an aaBB parent produces aB gametes, and the F1 offspring is dihybrid. The dihybrid can potentially produce 4 different gametes: Ab, aB, AB and ab. But if genes A and B are on the same chromosome as shown in the figure, the recombinant AB and ab gametes shown in red will only be produced if crossing over occurs between the two genes. [Note: Figure 8 shows a cross that begins with AAbb x aaBB, but the same principles apply with a cross between AABB x aabb to generate a dihybrid F1. In that case, Ab and aB would be recombinant.]
If the F1 offspring are subsequently testcrossed to a homozygous recessive individual with genotype aabb, the phenotype of the F2 offspring will be determined by the gametes of the dihybrid. So in this way, the phenotype of the F2 offspring can be used to infer the frequency of crossover events, or the frequency of recombination.

For unlinked genes, all four potential phenotypic classes – Ab, aB, AB, and ab – will be equally represented among the F2 offspring. This is the expected 1:1:1:1 ratio for a dihybrid testcross. But if the genes are linked, the parental classes Ab and aB will be over-represented, and the recombinant classes (which only result from crossing over) will be under-represented.
The percentage of recombinant F2 offspring indicates the distance between the two genes. The unit of distance is called a “map unit” or a “centiMorgan", abbreviated m.u. or cM.
An example of this from Sturtevant’s 1913 paper is shown in Figure 9. Wild-type flies have long wings and red eyes, but some mutant flies have miniature wings and/or white eyes. Using flies from true-breeding lines, females with miniature wings and white eyes were crossed with males with red eyes and long wings. All the F1 females were long red and presumably dihybrid. These dihybrid females were crossed to miniature white males, and the F2 offspring were counted.
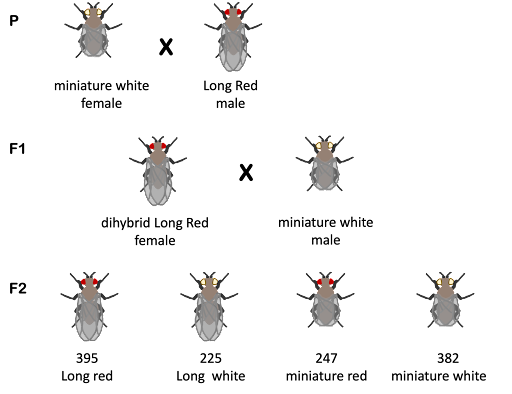
Among the F2 offspring, Sturtevant observed 395 Long Red, 225 Long white, 247 miniature red, and 382 miniature white. Long Red and miniature white are parental classes: those are the phenotypes of the P generation. The long white and miniature red phenotypic classes are recombinant, and they are underrepresented compared to the parental classes.
To calculate the recombination frequency, the equation below is used:
recombination frequency (%) = [latex]100*\frac{no.\; recombinants}{total\; no.\; of\; offspring}[/latex]
For the cross shown in Figure 9, the recombinant frequency is calculated as 38%.
[latex]100*\frac{225+247}{395+225+247+382}[/latex]
We would therefore conclude from these data that the white and miniature are 38 map units apart. Note however that Sturtevant combined this cross with others, so he ended with 1643 recombinants out of 4749 total flies, for a recombination frequency of 34.6%.
From recombination frequencies, a chromosome map can be drawn, indicating the distance between the two genes. Maps usually depict chromosomes as a straight line, with “tick marks” indicating the location of genes. Maps for the miniature and white genes are drawn in Figure 10.

On the left in Figure 10 is the map that would be drawn from the single cross shown in Figure 9. On the right is the map that would be drawn from Sturtevant’s combined data. The greater the number of offspring counted, the more reliable a map becomes. Drosophila are a powerful model organism for genetics, since many offspring can be generated in a short period of time – each female can produce hundreds of eggs, and a new generation reaches reproductive maturity in about two weeks.
Test Your Understanding
| Phenotype | # of F2 offspring |
| AB | 302 |
| Ab | 706 |
| aB | 695 |
| ab | 297 |
| total | 2000 |
| Phenotype | # of F2 offspring |
| EF | 305 |
| eF | 195 |
| Ef | 202 |
| ef | 298 |
| total | 1000 |
Media Attributions
- Figure 8 © Online Open Genetics, Chapter 7. Original-Deyholos is licensed under a CC BY-NC-SA (Attribution NonCommercial ShareAlike) license
- White female flies and Red males flies © Amanda Simons is licensed under a CC BY-SA (Attribution ShareAlike) license
- Distance between white and miniature © Amanda Simons is licensed under a CC BY-SA (Attribution ShareAlike) license
