
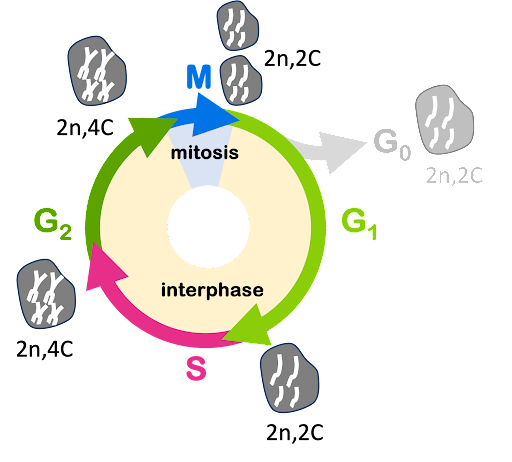
DNA content through the cell cycle
The stages of the cell cycle can be assessed experimentally by measuring the DNA content in the cell. As discussed in the module on Genome Structure, a genome of a cell can be described in terms of the ploidy (copies of the genome) as well as the number of chromosomes in the genome. For example, human cells are described as 2n=46, where 2 indicates a diploid genome, and 46 indicates the total number of chromosomes. If 2n = 46, then simple math tells us n=23: the human genome has 23 pairs of chromosomes. While this textbook most often focuses on diploid (2n) cells and organisms, it is important to remember that some organisms have other ploidy: haploid (1n), triploid (3n), tetraploid (4n) and other ploidies exist as well, and are common in some plants.
At the start of the cell cycle in G1 phase, a human cell has DNA chromosomes described as 2n (diploid), each chromosome consists of one DNA molecule, and DNA content described as 2C. But by the end of S phase, DNA has been replicated, and each chromosome consists of two DNA molecules/chromatids (Figure 3). By the end of S phase, content is described as 4C: the number of chromosomes (2n) hasn’t changed, but the total DNA content has doubled because each chromosome now consists of two chromatids. The DNA content for cells in each phase of the cell cycle is shown in Figure 4.
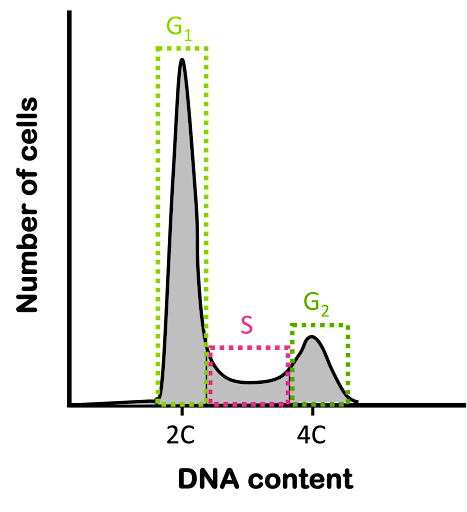
DNA content can be measured experimentally by using techniques like flow cytometry. Flow cytometry can measure the DNA content of single cells by labeling them with a fluorescent dye that binds to DNA: the cells are passed through a sensor that detects fluorescence, and the signal in each cell is measured. “Cyto” refers to cell, so “flow cytometry” refers to the measurement of the cells as they flow through the sensor.
Typically, an experiment measuring DNA content will present data from a population of cells, as shown in Figure 5, plotting the number of cells counted vs the fluorescent signal. The x-axis is often presented as DNA content rather than fluorescence, since the fluorescent signal is proportional to the amount of DNA in a cell.

When an asynchronous population of diploid cells is measured for DNA content, a two-peak pattern like that seen in Figure 5 is observed: the greatest number of cells typically have a DNA content of 2C and are presumed to be in G1 phase of the cell cycle. A smaller number of cells have a DNA content of 4C and are in G2 phase. And some cells have an intermediate amount of DNA content: these are in S phase of the cell cycle and are in the process of making additional DNA. The abundance of cells with each DNA content is proportional to the length of each stage of the cell cycle: if about 40% of the cell cycle is spent in G1 phase, about 40% of cells in an asynchronous population will be in G1 phase. This technique is often used to measure the effects of experimental manipulation on the cell cycle. It also can be used to measure the ploidy of a cell.
Test Your Understanding
Media Attributions
- DNA content of a cell © Amanda Simons is licensed under a CC BY-SA (Attribution ShareAlike) license
- DNA content graph © Amanda Simons is licensed under a CC BY-SA (Attribution ShareAlike) license
