
Epistasis
As discussed in the previous section, the canine B and D genes combine effects in a way that all four classes of offspring – BD, Bd, bD, and bd – have distinct phenotypes. But some gene pairs interact differently, with the alleles of one gene “masking” or overpowering the effects of another. This means that some classes of offspring may share the same phenotype.
This type of relationship is called epistasis, with the overpowering gene described as epistatic, and the hidden gene called hypostatic.
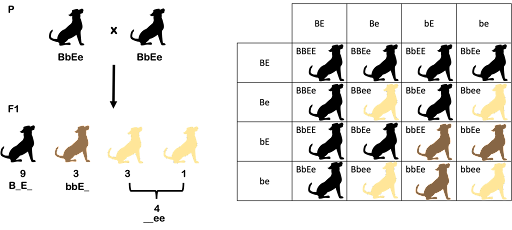
A classic example of epistasis is the relationship between the B and E loci in dogs. This relationship is most striking in the Labrador retriever breed although it is true for all other dog breeds as well. Standard colors for Labrador retrievers are black, yellow, and brown. These colors result from the combined effects of the B and E loci.
Remember, the B locus controls whether a dog produces black or brown pigment. But the E locus controls whether that pigment gets distributed to the fur. A dog with B_ genotype produces black pigment and a dog with bb genotype produces brown pigment. But if the dog also has the genotype ee, that dark pigment cannot be deposited in the fur, and the dog ends up with a yellow coat. The ee genotype overrides the B locus alleles, no matter what they are.
This also affects the expected offspring ratios. In a dihybrid cross, we’d expect offspring in a ratio of 9 B_E_ : 3 bbE_ : 3 B_ee : 1 bbee. But because the B_ee and bbee individuals are both yellow, we end up with a ratio of 9 B_E_ (black) : 4 __ee (yellow) : 3 bbE_ (brown). Two of the categories have combined into one! This is illustrated in Figure 6.
For the interaction between the B and E loci, the recessive e allele is the one that covers up the B phenotype. This form of epistasis is therefore called recessive epistasis. Other forms of epistasis exist as well. For example, If a dominant allele overpowers the other gene, then it is called dominant epistasis, and a 12:3:1 ratio results. If the dominant alleles of both genes yield the same phenotype, this is called duplicate dominant epistasis, and a 15:1 ratio results.
Table 2 lists some other forms of epistasis, including expected offspring ratios for a dihybrid cross. You’ll notice that in all cases, the 9:3:3:1 ratio collapses, so that there are fewer classes of offspring because one or more of the original ratio numbers have been combined together into one class. But the relative frequencies still all add up to 16.
It’s important to note that the name of the interaction can vary from author to author: for example, complementary gene interaction is sometimes called “duplicate recessive epistasis”. For the purposes of this textbook, we will group all these forms of interaction together under the collective term epistasis. It’s also important to note that this is not a complete list. There are other forms of gene interaction that could result in any of the dihybrid classes (AB, Ab, aB, and ab) sharing a phenotype.
| Type of interaction | Ratio | AB | Ab | aB | ab | ||||||||||||
|---|---|---|---|---|---|---|---|---|---|---|---|---|---|---|---|---|---|
| No Interaction | 9:3:3:1 | AB | AB | AB | AB | AB | AB | AB | AB | AB | Ab | Ab | Ab | aB | aB | aB | ab |
| Dominant epistasis | 12:3:1 | AB | AB | AB | AB | AB | AB | AB | AB | AB | Ab | Ab | Ab | aB | aB | aB | ab |
| Recessive epistasis | 9:3:4 | AB | AB | AB | AB | AB | AB | AB | AB | AB | Ab | Ab | Ab | aB | aB | aB | ab |
| Complementary gene interaction | 9:7 | AB | AB | AB | AB | AB | AB | AB | AB | AB | Ab | Ab | Ab | aB | aB | aB | ab |
| Duplicate genes | 15:1 | AB | AB | AB | AB | AB | AB | AB | AB | AB | Ab | Ab | Ab | aB | aB | aB | ab |
| Duplicate genes, cumulative effect | 9:6:1 | AB | AB | AB | AB | AB | AB | AB | AB | AB | Ab | Ab | Ab | aB | aB | aB | ab |
The offspring ratios indicate the type of molecular interaction.
The offspring ratios shown in Table 2 give geneticists a way to study gene interactions using a controlled cross: a researcher can set up a dihybrid cross and draw conclusions from the offspring ratios about how genes affect phenotype. Some great examples of this come from agricultural research. Just like Mendel’s original motivations, food production is a powerful motivator!
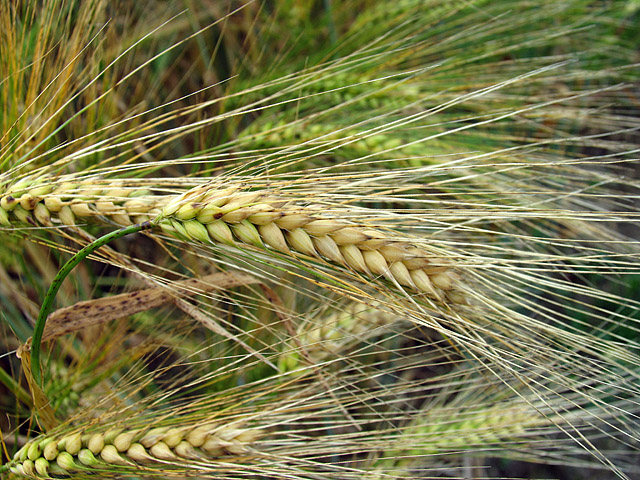
An example of this is awn length in barley, rice, and other cereals. Awns are the stiff bristle-like projections that give grasses a feathery appearance (Figure 7).
Barley can be awnless (no awns), have short awns, or long awns. Awns serve as sites of photosynthesis for the growing grain, so the presence of an awn can increase grain size and crop yield. But long awns also interfere with harvest and processing of the grain[1], so the genetics of awn development is pretty important in commercial agriculture.
If you think about the modes of inheritance we discussed in the modules on Basic Heredity and Allele Interactions, a good initial hypothesis might be that the intermediate (short awn) phenotype is caused by incompletely dominant alleles of a single gene. But that turns out to be incorrect: short-armed barley can be true-breeding.
Test Your Understanding
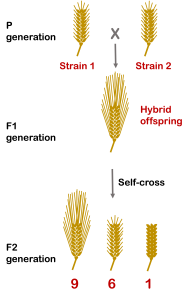
Controlled crosses reveal the underlying mechanism. In some cases, if two different true-breeding strains of barley with short awns are crossed, the resulting F1 offspring have long awns. Self-cross of the long-awned F1 give a ratio of 9 long awns : 6 short awns : 1 awnless[2]. A careful look reveals that this is a modified 9:3:3:1 ratio, which indicates that this is a dihybrid cross with two genes controlling the phenotypes. The 9:6:1 ratio further indicates that the two genes have a cumulative effect: a dominant allele at just one gene makes a short awn, and dominant alleles at two genes make the awn longer. This is illustrated in Figure 8.
Link to Animation of Figure 8.
Test Your Understanding
The awn genes in barley work together additively to perform duplicate function: The action of one gene (or the other) gives a partial phenotype, but the action of both genes gives a full phenotype. This is sometimes called duplicate gene interaction with cumulative effect.
An example of a slightly different kind of interaction is seen in wheat pigmentation. Wheat grains can be either red or white. If two true-breed red strains are crossed, the offspring are also red. But in certain cases, if the red F1 wheat hybrid is self-crossed, a ratio of 15 red : 1 white is seen. A 15:1 ratio is a modification of the 9:3:3:1 ratio expected from a dihybrid cross, so this indicates that the red color is controlled by two genes. The 9, 3, and 3 classes have all been combined into one class. The presence of at least one dominant allele from either gene is sufficient to produce the red color; recessive homozygosity at both genes (genotype aabb) is the only way to produce the white color.
Test Your Understanding
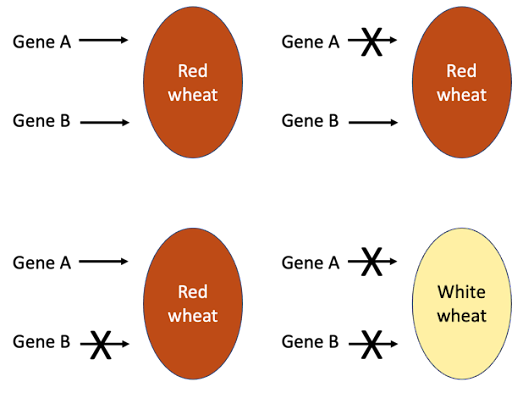
The 15:1 ratio is often seen if the two genes act redundantly in similar pathways. In Figure 9, genes A and B work in duplicate: at least one dominant allele of one gene will elicit the Red phenotype. This is why the phenomenon is sometimes called duplicate genes. A homozygous loss of function of gene A still results in red wheat, since gene B acts as backup. Likewise, loss of function of gene B still results in red wheat. But a loss of function in both genes causes the wheat to be colorless (called “white”).
The mutant phenotype will only be seen if there is a loss of function of both genes. The pigment-producing alleles are dominant, so to knockout function of both genes requires homozygous mutations: only wheat with a genotype of aabb will be colorless.
Media Attributions
- 9-3-3-1 phenotypic © Amanda Simons is licensed under a CC BY-SA (Attribution ShareAlike) license
- Barley Crop © Wikipedia is licensed under a CC0 (Creative Commons Zero) license
- Awn dihybrid cross with epistasis
- Red wheat strains © Amanda Simons is licensed under a CC BY-SA (Attribution ShareAlike) license
