
Eukaryotic genome structure
The genome of each eukaryotic species has a characteristic number of linear chromosomes found in the nucleus of each somatic cell; for example, humans have 46 nuclear chromosomes, mice have 40, and apples have 34.
In addition, mitochondria and chloroplasts also house their own DNA! So, in total, the human genome has 46 nuclear chromosomes, plus a mitochondrial chromosome. The apple genome has 34 nuclear chromosomes, plus a mitochondrial chromosome and a chloroplast chromosome.
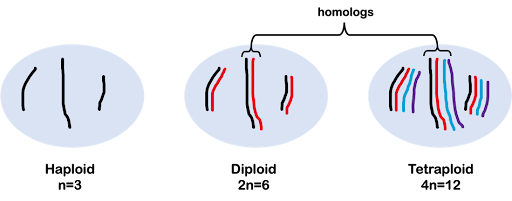
The ploidy of an organism’s genome describes the number of copies of each chromosome the organism typically has. A haploid genome consists of one copy of each chromosome, and a haploid organism likewise only has one copy of each chromosome (prokaryotes are haploid). A diploid organism is one in which each chromosome is represented in two copies, or homologs. Humans are diploid organisms with 23 pairs of nuclear chromosomes, for 46 total.
The homologs of a pair of chromosomes are very, very similar to one another (99.9% identical for humans![1]), but they will have small differences in DNA sequence.

As discussed more extensively in the module on Meiosis and Mitosis, we use the variable “n” to indicate the number of chromosomes in a single, haploid copy of the genome, with a multiplier to indicate ploidy. For example, 2n indicates a diploid with two copies of each chromosome, 3n indicates a triploid with three copies of each chromosome, and 4n indicates a tetraploid with four copies of each chromosome (Figure 3).
In this text, we primarily focus on genetics using diploid organisms (2n), but it’s important to note that other organisms have different genome copy numbers. For example, some bananas are triploid (3n) and some wheat is hexaploid (6n). Strawberries are an interesting example: different cultivars of strawberries are diploid, tetraploid, pentaploid, hexaploid, octoploid, or pentaploid!
You will also see the term aneuploidy. Aneuploid describes a cell or individual organism with an extra (or missing) portion of the genome compared to what is expected for that species.
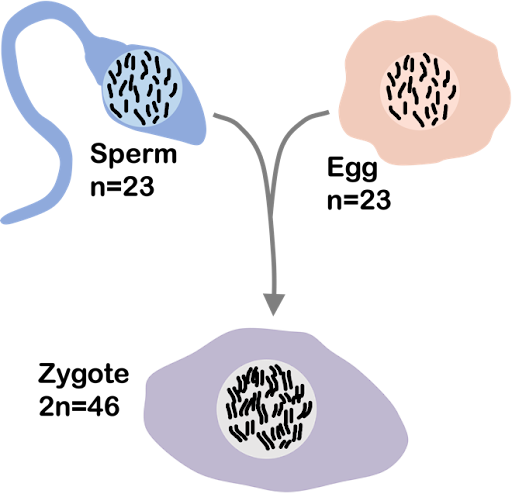
During sexual reproduction, only one copy from each pair is passed to offspring. Reproductive cells like egg or sperm, produced through the process of meiosis, have half the number of copies of the chromosome.
Human gametes (egg or sperm) are haploid, with 23 chromosomes (n=23). An egg and sperm come together to form a diploid zygote that develops into a mature organism. Each human thus typically 23 paternally-inherited nuclear chromosomes and 23 maternally-inherited nuclear chromosomes, with 46 total (2n=46), as shown in Figure 4.
Diploid offspring thus inherit one copy of each chromosome from each parent, for two copies total.
For organisms with more than two copies of the genome, gametes will still contain half the total chromosomes. So an octoploid strawberry, which has eight copies of each chromosome, will produce gametes that have four copies of each chromosome. Sometimes the genome of such plants would be written as 2n = 8x = 56 rather than just 8n = 56.
Organisms with an odd number of chromosome sets (like seedless watermelon and many cultivars of bananas) are often sterile: they cannot reproduce sexually. This is because the process of gametogenesis fails during meiosis I when chromosomes would normally pair. With an odd number of chromosome sets, pairing isn’t possible. Seedless watermelon are produced from a cross between a diploid and a tetraploid cultivar. New triploid banana plants are produced via vegetative propagation: rooting a new plant from outshoots of an older one.
Chromosomes vary dramatically in size, even within a species. For example, the smallest human chromosome is 48 megabases long (48 million bases), while the largest is 249 megabases. Note that although single-celled organisms and simpler eukaryotes do tend to have smaller genomes than higher eukaryotes, the complexity of an organism, the number of base pairs in the genome, the number of genes, and the number of chromosomes are not well correlated to one another. Table 1 compares the nuclear genomes for several diploid model organisms used regularly in life sciences research.
| Eukaryotic Species | Approximate size of nuclear haploid genome | Number of nuclear chromosomes in haploid genome | Approximate number of genes |
| Human
Homo sapiens |
3.1 billion bases | n = 23 | 20,500 |
| Chimpanzee
Pan troglodytes |
3.2 billion bases | n = 23 | 23,500 |
| Mouse
Mus musculus |
2.7 billion bases | n = 20 | 22,500 |
| Fruit fly
Drosophila melanogaster |
144 million bases | n = 4 | 14,000 |
| Roundworm
Caenorhabditis elegans |
100 million bases | n = 6 | 20,000 |
| Corn
Zea mays |
2.4 billion bases | n = 10 | 40,000 |
| Mustard weed
Aradbidopsis thaliana |
120 million bases | n = 5 | 27,500 |
A karyotype is a written description of an individual’s complete set of chromosomes. The karyotype of a typical human chromosomal male would be written, “46, XY”. A karyotype can also include any aneuploidies: abnormalities or deviations from expected chromosome number. For example, the karyotype of a male with Down syndrome, who has an extra copy of chromosome 21, would be written, “47, XY +21”. The genome of an individual who is aneuploid for sex chromosomes might be described as “47, XXX”.
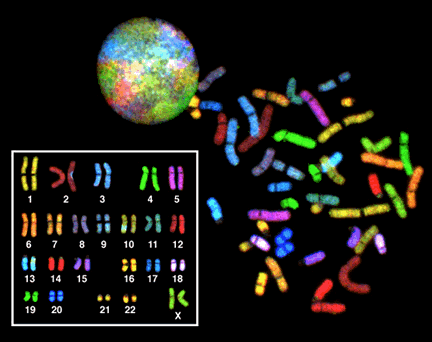
A karyogram is a visual depiction of a karyotype. It is an image of the chromosomes from a single cell, produced by manipulating microscopic images of a cell in metaphase. A karyogram from a human cell is shown below in Figure 5, reprinted from the chapter on DNA structure.
To produce a karyogram, cells undergoing division are used to produce a chromosome smear, where the chromosomes from a single cell are spread out on a microscope slide and separated visually. An image of the chromosome smear is then digitally cut apart and reassembled to pair the maternal and paternal copies of each chromosome next to one another. This makes it easy to see any chromosomal abnormalities.
Figure 5 was produced by staining the chromosomes using a technique called “SKY”, or spectral karyotyping. Each chromosome appears a different color because it is tagged with a different combination of fluorescent molecules. At the top left of Figure 5, the round colorful circle is an interphase nucleus. The different colored patches are areas of the nucleus occupied by different uncondensed chromosomes. Note that without the colored staining, the chromosomes would just be part of a single, uniform mass: there are no distinct boundaries between the chromosomes.
On the right in the image is a spread of chromosomes from a single mitotic nucleus. Individual condensed chromosomes have been released from the cell and are spread out on a microscope slide. The chromosomes are stained many different colors, but if you look carefully, you will see that there are two chromosomes of each color.
In the inset image on the bottom left of Figure 5, this metaphase spread has been digitally manipulated to pair up the homologous pairs. You’ll see that the pairs of the chromosomes are the same ones from the spread: For example, the red C-shaped copy of chromosome 2 can be found toward the bottom right of the spread, and its homolog appears to have a blue spot in the karyogram because it is slightly overlapped by a blue chromosome 3 toward the top left of the spread.
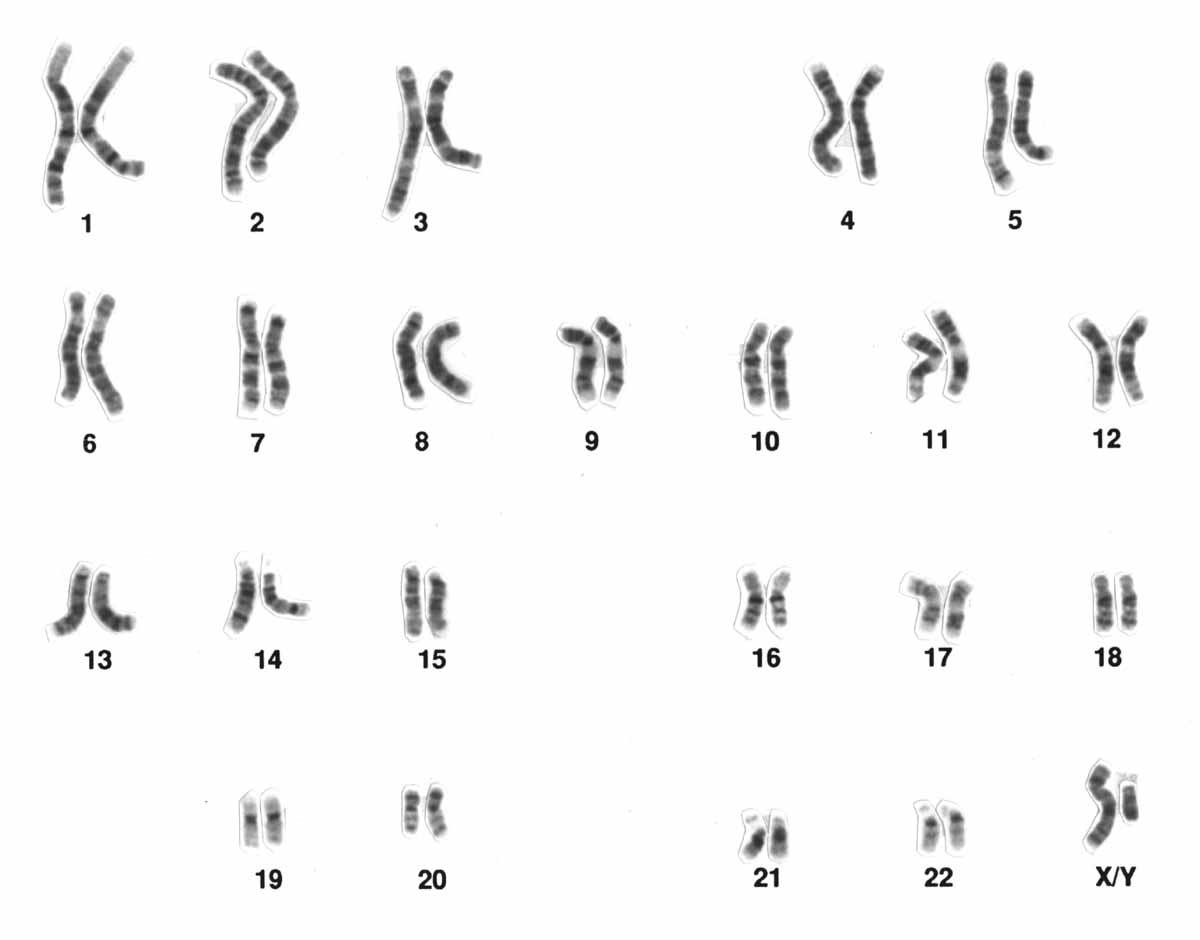
Karyograms are produced by staining chromosomes by other methods as well. For example, one of the most common dyes used is Giemsa stain, which has greater affinity for A-T rich regions of DNA. When DNA is stained with Giemsa, the chromosomes appear banded: light in color in areas where the DNA has a high percentage of G-C base pairs, and dark where the DNA has a high percentage of A-T base pairs. Because each chromosome has a different DNA sequence, each chromosome has a characteristic striped (or “band”) pattern: those bands can be used to identify individual chromosomes under the microscope. Other methods of staining exist as well: one method stains centromeres, another stains G-C rich regions, and another stains telomeres more darkly than the rest of the chromosome.
Figure 6 shows a Giemsa stained karyogram. Although Figure 3 and Figure 4 were produced using different staining techniques, both karyograms arrange the chromosomes in the same pattern: By convention, human karyograms are arranged with chromosomes 1 to 5 in the top row, 6 to 12 in the second, 13 to 18 in the third, and 19 to 22 and XY in the bottom.
Chromosomes numbered 1-22 are called the autosomes: both males and females have two copies of each. The X and Y chromosomes are a little different. These are the sex chromosomes, so-called because they play a role in determining sex phenotype. Mammalian females, including humans, typically have two X chromosomes, with males having one X and one Y. The karyogram in Figure 3 was obtained from a chromosomal female: you can see two similar-length green X chromosomes. In the typical male karyogram in Figure 4, you can see the X and Y chromosomes paired in the bottom right of the karyogram. The Y chromosome is much shorter than the X chromosome.
The chromosomes in the karyograms are arranged from largest to smallest: the chromosomes were numbered based on their size. The only exceptions to this are the sex chromosomes (X and Y), and chromosome 21, which is smaller than chromosome 22. Although chromosome 22 was originally thought to be the smallest, later analysis showed that chromosome 21 is shorter.
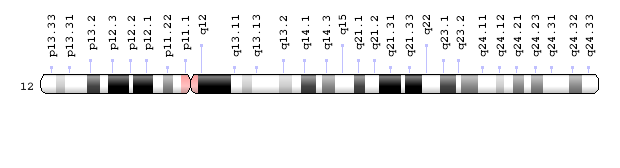
The patterns produced by Giemsa staining, as in Figure 6, are called G-banding. Because each chromosome has a characteristic banding pattern, the bands have been used to identify features – and sometimes abnormalities – of individual chromosomes. Loci (or locations) on a chromosome are often described by their position relative to G-bands. The G-bands are numbered based on their position relative to the centromere. Chromosome maps called ideograms diagram the bands of a chromosome. A human Chromosome 12 ideogram is shown in Figure 7.
Briefly, the short arm of the chromosome is called p, the long arm is called q, and the bands are numbered outward from the centromere. So band 12q13.11 is on the long arm of chromosome 12, and it is closer to the centromere than band 12q24.32. The bands on a chromosome do not correspond to individual genes. Each band may include millions of base pairs and hold hundreds of genes.
Media Attributions
- Ploidy of a cell © Amanda Simons is licensed under a CC BY-SA (Attribution ShareAlike) license
- Human gametes © Amanda Simons is licensed under a CC BY-SA (Attribution ShareAlike) license
- FISH (Fluorescence in situ hybridization) © Wikipedia is licensed under a Public Domain license
- Human male karyotpe © Wikipedia is licensed under a Public Domain license
- Human chromosome 12 ideogram © Wikipedia is licensed under a CC BY-SA (Attribution ShareAlike) license
- Zhang, X.-O., Pratt, H. & Weng, Z. Investigating the Potential Roles of SINEs in the Human Genome. Annu. Rev. Genom. Hum. Genet. 22, 199–218 (2021). ↵
