
Genome-Wide Association Studies (GWAS)
All the linkage examples above, including two- and three-point test crosses and pedigree analysis, rely on pair-wise analysis of phenotypes and/or molecular markers. But this is slow.

In the case of the Huntington’s Disease mapping, it took decades of work and the construction of extensive pedigrees in a large Venezuelan family with Huntington Disease to identify the HTT gene. The project was propelled by the geneticist Nancy Wexler (Figure 22), who began the project because she watched her mother, grandfather, and three uncles suffer from the disease. It also greatly depended on the willing participation of the Venezuelan family, many of whom understandably were initially suspicious of Dr. Wexler’s motivations for the project.
Over three decades, Dr. Wexler and her colleagues tracked phenotypes in 10 generations and 18,000 individuals, processing 4,000 blood samples to look for molecular markers. (Dr. Wexler’s foundation also founded a nursing home for HD patients in this region of Venezuela, sending tens of millions of dollars in clinical support to the affected community.) If you’re interested in learning more about Dr. Wexler and her work, you can read interviews with her from the Lasker Foundation and the New York Times.
The identification of the HTT gene was truly an accomplishment in the days before the Human Genome Project. But with the advent of genome sequencing in the early 2000s, identifying regions of a chromosome associated with a phenotype shifted to large-scale data analysis. Rather than looking for a link between two genes at a time, we can now study the association of a trait with millions of sequence variants in one experiment.
Genome-wide association studies (GWAS) compare sequence information for the entire genome at once. The most common version of a GWAS uses SNP microarrays that test hundreds of thousands of SNPs (or even millions!) at once.
GWAS do not need to test every SNP in the genome to have a good understanding of genomic sequence as a whole, since several adjacent SNPs may be linked within a haplotype.
Test Your Understanding
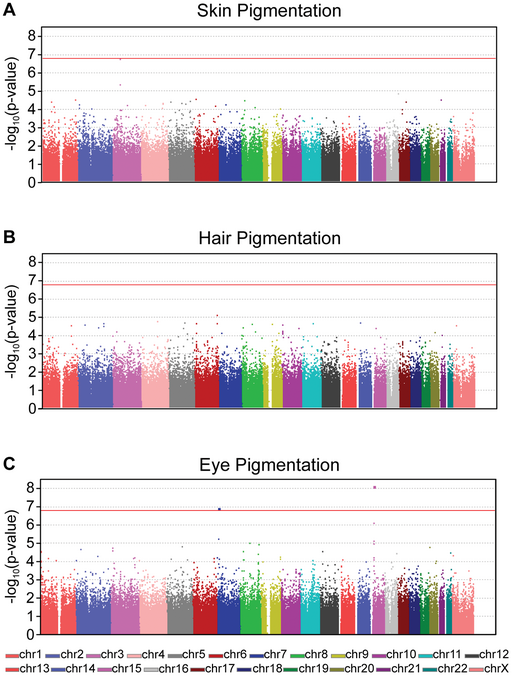
To perform GWAS, sequence variants from two groups of people are compared: those with a certain phenotype (cases) and those without the phenotype (control). The bigger the cohorts, the more likely a genetic association can be identified. Powerful statistical software is used to compare the frequency of each individual variant (up to 2,000,000 at a time) in each group (case or control). The statistical significance of any difference is often presented in a Manhattan plot like that seen in Figure 23, which looks at GWAS for pigmentation in skin, hair, and eyes.
A Manhattan plot arranges all SNPs along the X-axis according to position, and the statistical significance of an association between SNP and phenotype on the Y-axis, reported as -log10(p-value). Each dot on the plot therefore represents one SNP. The threshold for statistical significance is indicated by the red line in Figure 23, so a dot that falls at or above the line represents a SNP that is a candidate for association with the measured phenotype. (The threshold for significance is corrected for the number of SNPs, so the threshold will be different for different studies.)
GWAS can be complicated by the fact that many phenotypes are multifactorial, with multiple genes associated with the phenotype and environmental factors increasing or decreasing susceptibility. However, because they compare such large data sets, GWAS can identify associated variants that contribute in part to a complex phenotype.
The example presented in Figure 23 uses SNP microarray analysis with 317,503 SNPs. So, as with the molecular linkage experiments described earlier, the assay only identifies markers that are associated with the trait, finding potential haplotypes within the study participants. These SNPs represent only 0.01% of the genome, but since they are spread throughout the genome they give good coverage to identify linked genes. Further analysis is still needed afterward to identify candidate genes near the SNP.
Genome-wide association studies can also be performed with exome sequencing and whole-genome sequencing. These give much more coverage and can identify specific sequences associated with a trait. But they are also more expensive to perform.
Exome analysis provides the sequence for the expressed regions of the genome – those regions transcribed into RNA. The idea is that the protein-coding regions of the genome are the most likely to affect phenotype, but only make up about 1% of the whole genome. So exome analysis can identify many sequence variants with only slight sacrifice to impactful genomic coverage. But exome sequencing cannot pick up variants in regulatory sequence. Since promoter regions, enhancer regions, and even some intron sequences can have a profound effect on the amount of protein produced, exome sequencing can miss some associations.
Family exome analysis compares the exome of members of a family and can be particularly helpful in identifying de novo mutations. Because families share genomic sequence (50% for parent and child, 25% for siblings), sequence that is different among family members with different phenotypes is a candidate for a mutation associated with the phenotype. Remember, though, every child will have a handful of mutations that are not present in the parent. Thus, even if a mutation is identified through family exome analysis, it does not mean that the mutation causes the phenotype in question.
Whole genome sequencing, in contrast, offers full coverage of the genome. But as it is much more expensive to sequence a whole genome than it is to sequence 1% of the genome, whole genome sequencing is not yet the most common method for GWAS. As costs for sequencing continue to decrease, it’s likely that whole genome sequencing will become more readily used.
We started this module with a description of ALS. Ice Bucket Challenge funding has allowed the identification of genes involved in familial ALS. Much of this work has used GWAS, family exome sequencing, and various applications of SNP microarrays.
Test Your Understanding
Media Attributions
- Nancy Wexler © Christopher Michel via. Wikipedia is licensed under a CC BY-SA (Attribution ShareAlike) license
- Manhattan plots for the GWAS © Sophie I. Candille , Devin M. Absher, Sandra Beleza, Marc Bauchet, Brian McEvoy, Nanibaa’ A. Garrison, Jun Z. Li, Richard M. Myers, Gregory S. Barsh, Hua Tang , Mark D. Shriver - Candille SI, Absher DM, Beleza S, Bauchet M, McEvoy B, Garrison NA, et al. via. Wikipedia is licensed under a CC BY-NC-SA (Attribution NonCommercial ShareAlike) license
