Measuring evolution: Molecular clocks
Mutations occur naturally and accumulate in a population over time. For this reason, the oldest populations – the ones that have been sustained through the most generations – tend to have the most variation. Young, newly established populations often have very little variation. The number of variants within a single population and between two populations can thus be used as a sort of molecular clock if we assume that mutations accumulate at a relatively consistent rate.
Figure 10 shows an example of a hypothetical molecular clock. In this example, two lineages diverged 50 million years ago about share 4 differences . If a third lineage was found to have twice as many differences, one might hypothesize that this third lineage last shared a common ancestor with these two 100 million years ago.
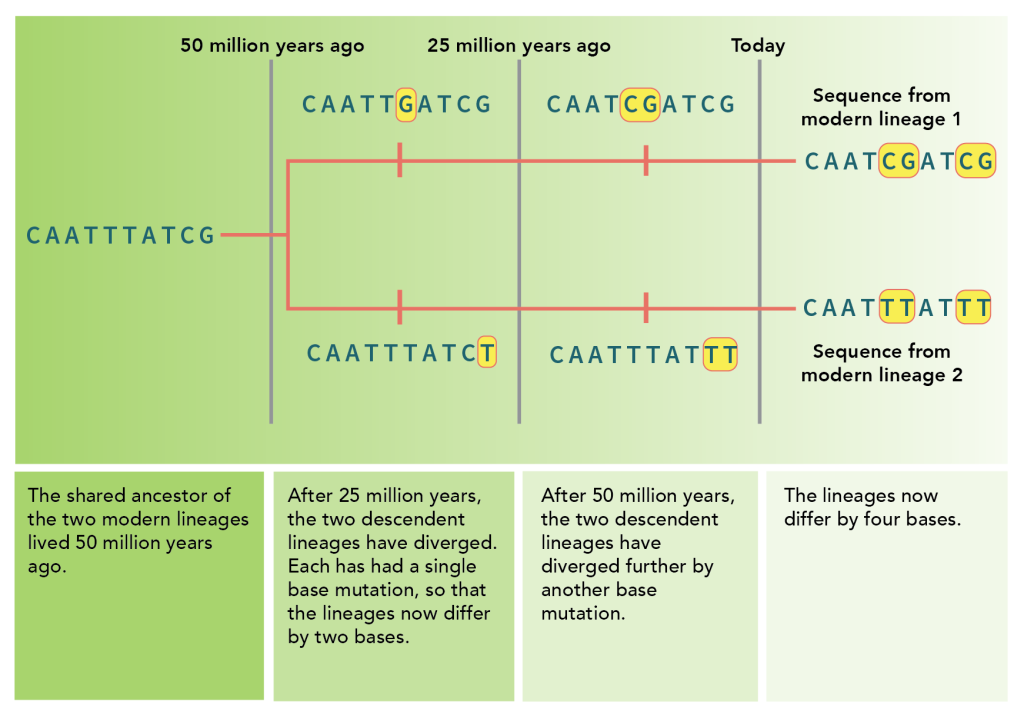
The rate of mutation can be different depending on species, environment, and part of the genome. Therefore, the number of mutations can be very useful in determining relative timeframes for the age of a population, but they need to be “calibrated” by comparing them to fossil or archaeology records for a more precise estimate of age.
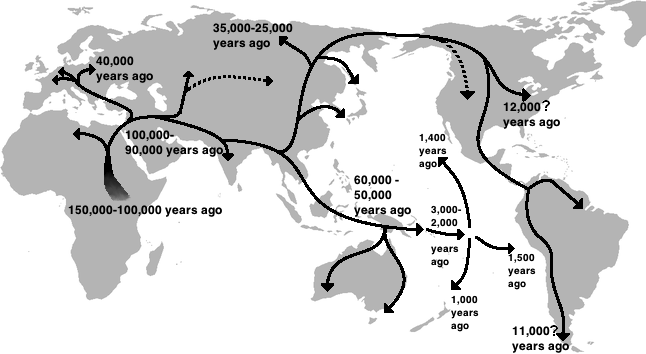
As an example from humans, humans as a species (Homo sapiens) are thought to have originated in Africa. Ancient ancestral humans then migrated out of Africa, gradually populating other parts of the globe. Figure 11 shows a map that diagrams the routes early humans took as they migrated out of Africa. These migration patterns were originally hypothesized by dating archaeological remains.
The oldest human populations are thus found in Africa, and the youngest in South America and the Pacific Islands. The molecular clock supports this hypothesis: by far the most diverse indigenous populations are found in Africa. In fact, most of the genetic variation in the human population worldwide is found in African populations! The younger indigenous populations in the Americas and Pacific Islands are more genetically homogenous.
Note that the amount of diversity alone, however, does not allow determination of precise dates. Instead, a comparison of the molecular variation with the archaeological data allows the molecular clock to be calibrated. Then, age can be estimated for populations where minimal archaeological data is available.
The accumulation of mutations over time can also be used to determine relationships among species (and individuals within a species). Because some sequences are conserved more than others, the choice of a comparative sequence can affect the analysis.
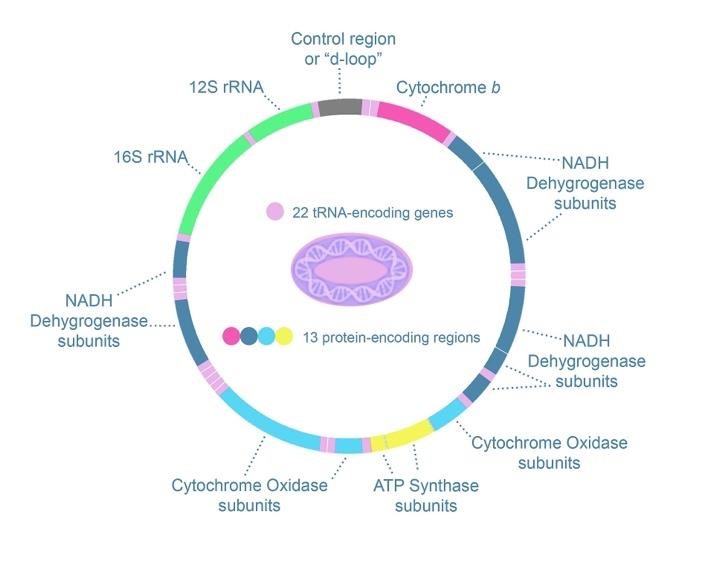
For example, some parts of the genome don’t vary much because they are under strong selection: almost any change to the sequence would decrease the reproductive fitness of an individual. These conserved regions of the genome are less useful in establishing relationships within a species because most of the sequence is the same regardless of which individual is tested. But other parts of the genome are highly variable: certain intragenic regions of the genome away from important regulatory sequences can show lots of variation, as are certain regions of mitochondrial DNA.
On the other hand, these highly variable regions of the genome are less useful in comparing relationships among species: if they are too different, no comparison is possible. For example, the so-called D-loop region of mtDNA, shown in Figure 12, is highly variable and useful in comparing relationships among humans. mtDNA overall is estimated to undergo mutations at twice the rate of nuclear DNA, with several hypervariable regions in the noncoding D-loop of the chromosome[1]. But these regions are so different in humans compared to other primates that it is less useful in constructing a phylogenetic tree even of primates.[2] In comparing relationships among species, more conserved regions of the genome may be better suited.
Constructing an Evolutionary Family Tree
The number of genomic differences can then be compared among individuals in a population or between species. There are a few different ways to mathematically weight the differences, but the general principle is that the fewer the differences, the more closely the two subjects are related. Geneticists construct a cladogram to illustrate these relationships.
Note: The terms phylogenetic tree, cladogram, and dendrogram all describe similar images. While there are some differences between the terms, many biologists use these terms interchangeably, and the differences will not be addressed here. A clade is a branch on the family tree.
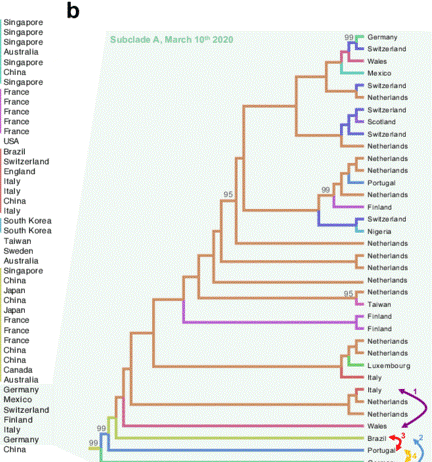
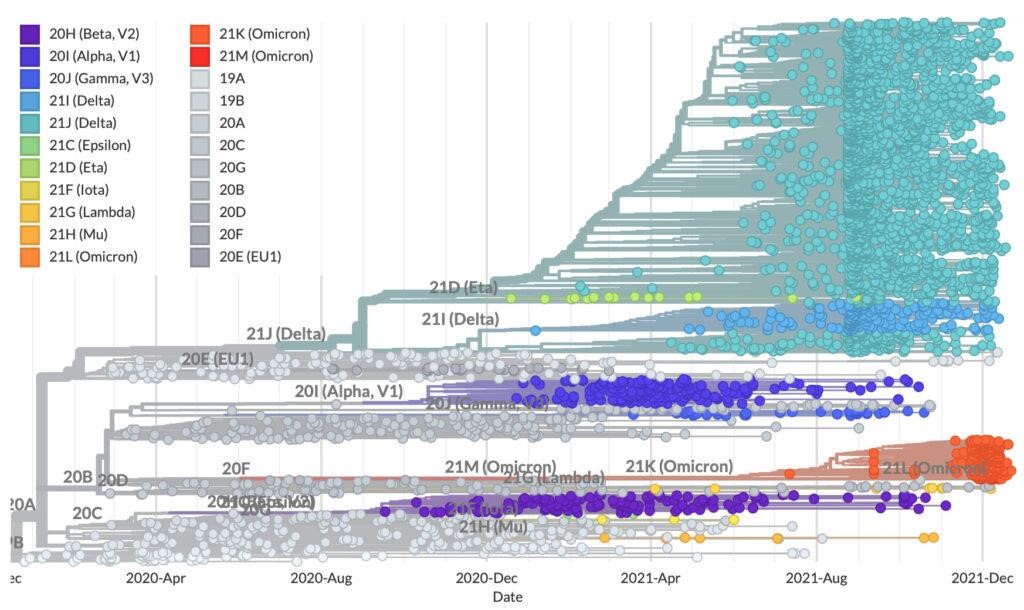
Figure 13 gives an example of a cladogram and shows how sequence analysis was used in virus tracking during the early days of the COVID-19 pandemic. In the tree shown on the left, the sequences of individual patient samples were compared, and labeled with their country of origin. Shorter branches represent patient samples with a more recent common ancestor, which gives a clue to how the virus spread geographically. The tree shown on the right tracks COVID variants as they arose among patient samples in 2020-2021.
Note that some variants disappeared from the population early on and were out-competed by Delta variants by the end of 2021. Although these data stop at the end of 2021, the beginning of the rise of Omicron variants can be seen in the red clade.
Media Attributions
- Figure 10 Molecular Clocks is licensed under a CC BY-NC-SA (Attribution NonCommercial ShareAlike) license
- Figure 11 Human Global Migration Patterns © Ephert is licensed under a CC BY-SA (Attribution ShareAlike) license
- Figure 12 Map of the mtDNA chromosome © BQUB17-JHolguera is licensed under a CC BY-SA (Attribution ShareAlike) license
- Figure 13 left Sequence Analysis © Researchgate.net is licensed under a CC BY-NC-ND (Attribution NonCommercial NoDerivatives) license
- Figure 13 (bottom) Sequence Analysis is licensed under a CC BY-NC (Attribution NonCommercial) license
- Nicholls, T. J. & Minczuk, M. In D-loop: 40 years of mitochondrial 7S DNA. Exp. Gerontol. 56, 175–181 (2014). ↵
- Horai, S., Hayasaka, K., Kondo, R., Tsugane, K. & Takahata, N. Recent African origin of modern humans revealed by complete sequences of hominoid mitochondrial DNAs. Proc. Natl. Acad. Sci. U. S. A. 92, 532–536 (1995). ↵

