Mendel’s Experiments

Mendel used pea plants as a model organism to study inheritance. A model organism is one that is studied to draw more general conclusions about biology. For example, although Mendel studied peas, his conclusions are applicable to all diploid organisms.
Why peas? Model organisms are usually chosen for practical reasons. Peas are easy to grow and have a short growing season. From seed to harvest takes about two months, so Mendel could grow many generations of plants in a year. There are many easily identifiable variations of pea plants, so Mendel could track the inheritance of these traits. And the flowers of the plants – the reproductive organs – are large enough to be easily manipulated to ensure controlled crosses between plants.
Mendel had several true-breeding strains of pea plants, each of which varied in one of seven characters: seed shape, seed color, flower color, pod shape, pod color, stem placement, and size. True-breeding means that, generation after generation, these traits breed true: all offspring look like their parents. Mendel carefully controlled breeding to cross these true-breeding strains, transferring pollen from the stamen of one plant to the stigma of another plant.
He recorded the appearance of thousands of offspring over several generations.
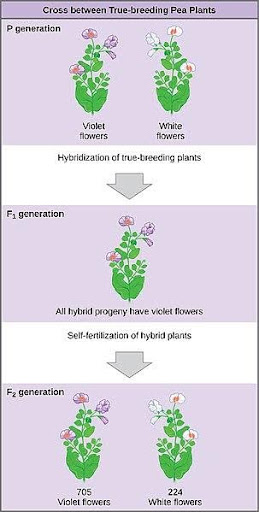
Because of Mendel’s background in physics, chemistry, and math, he was prepared to recognize certain mathematical patterns. Just like chemical reactions consistently produced characteristic ratios of products, he noticed that crosses produced offspring with predictable traits, and those traits were present in characteristic ratios within the population of offspring. An example of one such cross is shown in Figure 4.
If he crossed plants that varied in a single character – purple flowers and white flowers, for example – he found that the first generation of offspring always matched the appearance of one of the parents. There was no blending!
In modern terms, we call the parents the P generation and the offspring the F1 generation. F1 stands for first filial generation – filial means child.
For the example of the P generation of purple crossed with white flowers, all the F1 offspring were purple. If two F1 offspring were crossed, though, both traits of the original parents would be seen in the next generation, called the F2 generation. For the purple flower x white flower cross, there were both purple and white F2 offspring. Mendel called purple the “dominating” trait; in modern terms we use the word dominant. Mendel called white the recessive trait, a term that we still use today.
This is where Mendel’s math and chemistry background came in. Mendel was used to calculating the ratios of products to reactants in his studies of chemistry, just like you might have done when balancing reactions in your chemistry class. So, when Mendel observed a mixture of traits in the offspring, he calculated the ratios in which they appeared in the population. Because of his unique educational background, Mendel was one of the first researchers to think to apply such quantitative methods to studies of biology.
Mendel logged the traits of thousands of pea plant offspring, as shown in Table 5. Mendel realized that, in the F2 generation, the ratio of the dominant trait to the recessive trait was always approximately 3:1, or ¾ dominant and ¼ recessive.
Further self-fertilization of the F2 revealed that the recessive trait was always true-breeding. Some of the dominant F2 were also true-breeding, but other dominant F2 offspring were not. He thus revised his ratio to 1:2:1 true-breeding dominant: hybrid dominant (that did not breed true): true-breeding recessive.
| Trait | Dominant vs Recessive | F2 Generation (Dominant) | F2 Generation (Recessive) | Ratio |
| Seed Shape | Round vs wrinkled | 5474 | 1850 | 2.96:1 |
| Seed Color | Yellow vs green | 6022 | 2001 | 3.01:1 |
| Flower color | Purple vs white | 705 | 224 | 3.15:1 |
| Pod shape | Inflated vs constricted | 882 | 299 | 2.95:1 |
| Pod color | Yellow vs green | 428 | 152 | 2.81:1 |
| Flower position | Axial vs terminal | 651 | 207 | 3.14:1 |
| Plant height | Tall vs short | 787 | 227 | 2.84:1 |
Media Attributions
- Mendel’s crosses © OpenStax is licensed under a CC BY-SA (Attribution ShareAlike) license

