
Pedigree analysis
While adoption and twin studies can suggest a genetic or non-genetic cause for a trait, tracking a trait through multiple generations of an extended family can provide additional information.
Pedigrees are pictorial representations of a family tree, used to track phenotypes (or sometimes genotypes) through a family. They are most commonly used to study rare traits in a population.
Pedigrees can be used to determine the mode of inheritance for a particular trait. The mode of inheritance refers to how a trait is encoded by the genome: is it a dominant or recessive trait? Is it encoded on an autosome, sex chromosome, or mitochondrial chromosome? We will look at the patterns for six different modes of inheritance: autosomal dominant, autosomal recessive, X-linked dominant, X-linked recessive, Y-linked, and mitochondrial. We will also use pedigrees to determine the risk of an individual developing a trait or disease.
By convention, a standard set of symbols are used to represent males and females, parents and children. Squares represent males, and circles represent females. An individual of unknown sex is indicated by a diamond. A diamond is also sometimes used to indicate someone who is intersex or of nonbinary gender, although this is not common usage and is not accepted by all in the nonbinary or genetics communities.
A horizontal line connects a pair of parents, with a vertical line connecting parents to offspring. An individual who has the phenotype tracked in the pedigree will be indicated by a filled-in shape, while an individual who does not show the phenotype will be indicated by an empty shape. An individual with a trait is also said to be affected by the trait.
If parents have more than one offspring, the vertical offspring line will be connected with a square fork, with siblings oldest to youngest arranged left to right. Each generation is indicated by a Roman numeral, with “I” being the oldest generation. Within a generation, individuals are numbered with Arabic numerals, starting with “1” and counting left to right.
Two example pedigrees are shown in Figure 1. On the left is a family with one child who is affected by the trait. On the right is a pedigree with three children, the oldest being male and the two youngest female.
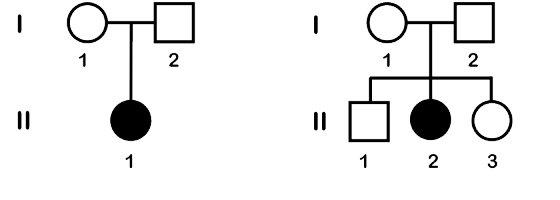
In many cases, a pedigree is first constructed in response to an individual who comes to the medical community. This person is called the propositus or the proband, and they are indicated on the pedigree with an arrow. In Figure 1, the proband is individual II-1.
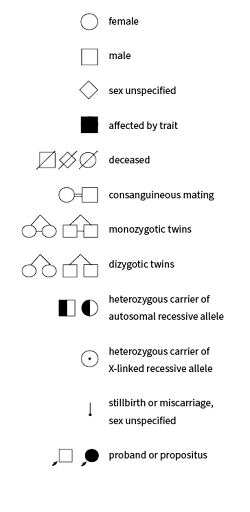
Additional symbols may be also used in genetic pedigrees, including symbols that indicate heterozygous carriers of an allele (who do not show the trait), symbols to represent consanguineous mating (parents who are blood relations), symbols to represent twins, and symbols that include adopted family members. A selection of some pedigree symbols is shown in Figure 2.
A note on how sex is depicted in pedigrees
Historically, circles have been used to represent females and squares males in pedigrees. As geneticists gain a better understanding of sex and gender, however, it becomes increasingly apparent that this is not always an accurate representation of either an individual’s sex or gender. Remember from the module on sex that there are multiple ways to define “male” and “female”. For example, an individual with chromosomes typically associated with males (XY) can have gonads and/or external anatomy that is typically associated with females. Likewise, an individual with chromosomes typically associated with females can have gonads and/or external anatomy that is typically associated with males. Depending on the purpose of the pedigree, different definitions of male and female may be more useful than others.
In this module, we will use pedigrees to determine mode of inheritance, including whether a gene is carried on the X- or Y- chromosome. Therefore, unless otherwise indicated, we will most often use the symbols to represent chromosomal sex, with circles to represent people with the most common female chromosomal genotype (XX) and squares to represent people with the most common male chromosomal genotype (XY). It should be understood that this is not a complete description of any individual’s sex (sex assigned at birth, sex determined by external genitalia, or gonadal sex may be different may be different from chromosomal sex) or gender (which may be cisgender or transgender).
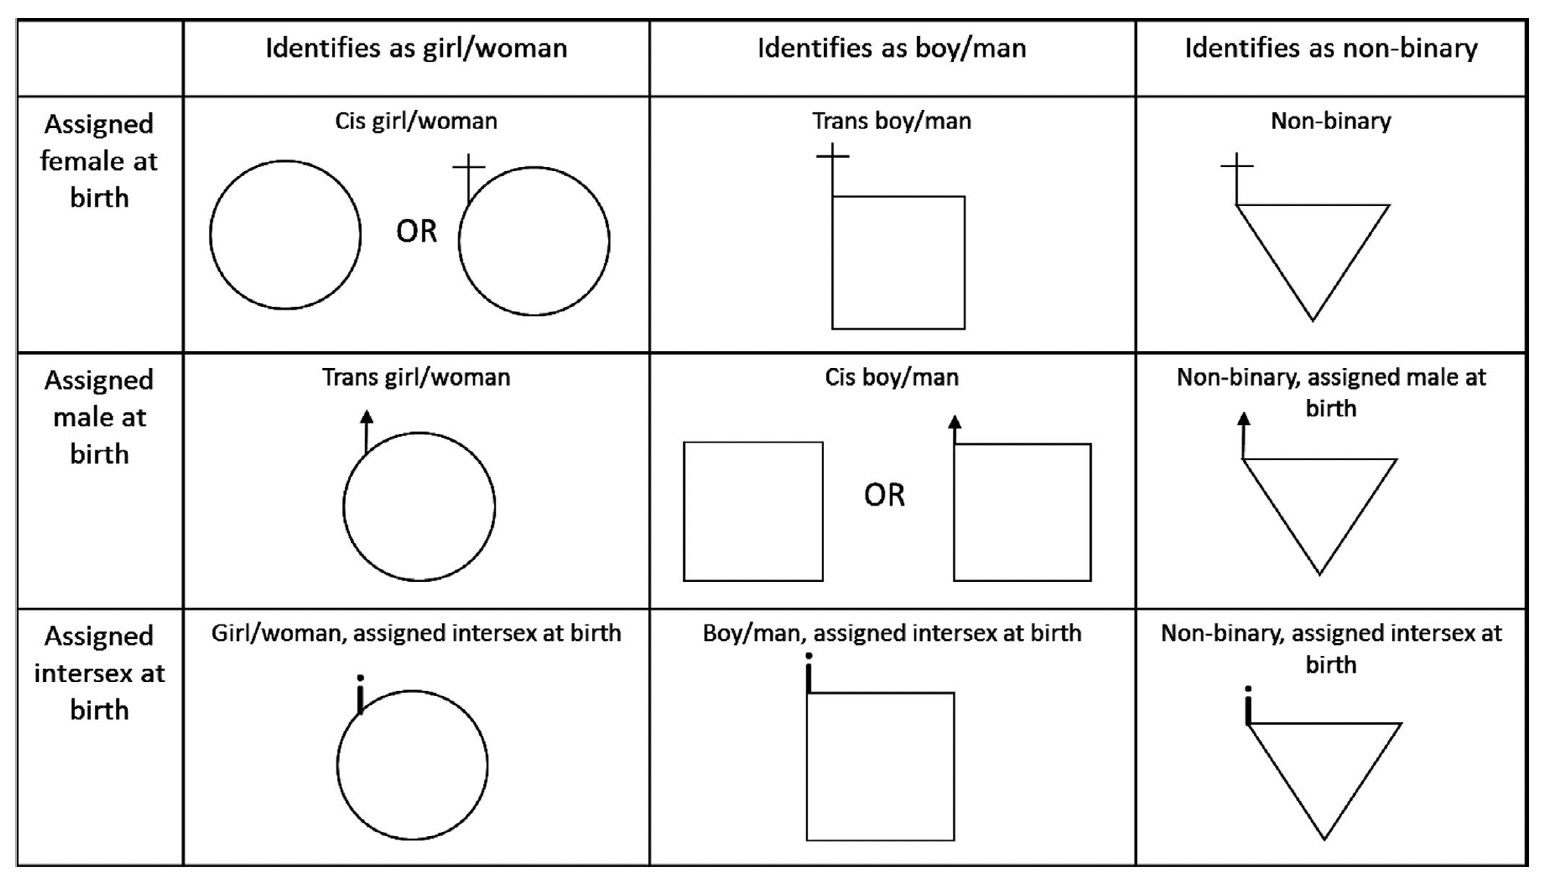
Other symbols may offer a more complete or accurate representation of a person’s sex or gender. While there is not currently a single standard for representation of transgender and gender diverse individuals or individuals with differences of sex development, there are a number of proposals from within the genetic counseling community[1][2]. One example, from Tuite et al (2020), is shown in Table 2.
Table 2. Gender inclusive pedigree symbols.
Uses and limitations of pedigree analysis
Like twin and adoption studies, pedigree analysis has limitations. A single family is, by definition, only a very small fraction of the population. Small sample sizes can make it seem like patterns are caused by an underlying genetic mechanism when it is really just random variation. As an example, we expect about 50% of the human population as a whole to be male. But due to the randomness inherent in meiosis (and biology in general!) many individual families may have all male offspring or all female offspring. In this way, as we interpret pedigrees, we must distinguish between what is most likely, what is possible (even though unlikely), and what can be ruled out. It’s also important to remember that pedigrees represent the best-available information about a family. It often relies on information recalled from family members. If signs and symptoms of a trait are variable, or information is incomplete, a pedigree can lead to a mistaken conclusion. Incomplete penetrance of a trait can also make interpretation difficult.
Inferring the Mode of Inheritance
Pedigree analysis can be used to determine the mode of inheritance of a particular trait, allowing geneticists to begin to identify a gene (or genes) responsible. The mode of inheritance refers to how a trait is inherited: is it dominant or recessive? Is the gene located on a sex chromosome, an autosome, or the mitochondrial chromosome? We will look at six modes of inheritance in this module: autosomal dominant, autosomal recessive, X-linked dominant, X-linked recessive , Y-linked, and mitochondrial inheritance.
We will look for patterns among small nuclear families (parent/child relationships) within the extended family. Certain inheritance patterns allow geneticists to conclusively rule out modes of inheritance, so the remaining modes can be evaluated for likelihood. Each of the six modes is considered below.
Y-linked inheritance
One of the easiest modes of inheritance to identify in pedigrees is Y-linked inheritance. This is because Y-linked traits are present only in chromosomal males (who have a Y chromosome). The traits are passed from father to son, with no exceptions.
An example of a Y-linked pedigree is shown in Figure 3. Assuming complete penetrance, every affected son has an affected father. No females are affected. Y-linked inheritance can be ruled out if chromosomal females have the trait or if fathers and sons do not have the same phenotype.

Although Y-linked pedigrees are easy to identify, Y-linked pedigrees are quite rare outside of textbooks. The Y chromosome is the smallest of the human nuclear chromosomes, and, by some estimates, the Y chromosome may carry only about 55-70 protein-coding genes. By contrast, the smallest autosome (chromosome 21) likely carries about 200-300 protein-coding genes, and the X chromosome carries about 800 protein-coding genes. The small number of Y-linked genes makes Y-linked traits quite rare. Some regions of the Y chromosome appear to be linked to defects in sperm development, and Y chromosome variants may be associated with coronary artery disease.[3] But evidence linking other traits to the Y chromosome has proven to be insufficient. The most commonly cited example of a rare Y-linked trait is hairy pinnae (the outer rim of the ear). Although pedigree analysis suggested Y-linkage, subsequent analysis seems to show that the trait is an autosomally inherited sex-influenced trait.
Mitochondrial inheritance
Like Y-linked inheritance, mitochondrial inheritance is also quite easy to identify in a pedigree, but rare in the human population. The mitochondrial chromosome contains 37 genes (13 protein-coding). Sperm do not contribute mitochondria to a fertilized zygote: all mitochondria (and thus, mitochondrial DNA) comes from the egg. Because of this, mitochondrial traits are passed from a mother to all of her offspring, both male and female. Assuming complete penetrance, a child with a mitochondrial trait must have a mother with the trait. Fathers can never pass the trait to their sons.
An example of a pedigree consistent with a mitochondrial trait is shown in Figure 4. Mitochondrial inheritance can be ruled out if the trait passes from father to child, or if children of an affected mother do not have the trait.

X-linked dominant inheritance (XD)
As with AD inheritance, all children affected with an XD trait must also have an affected parent. X-linked dominance means that the gene causing the phenotype is located on the X-chromosome. All XY individuals who inherit the allele will show the trait, since they have no second allele to modify the phenotype. All XX individuals who inherit at least one copy of the allele will show the trait as well: a second allele on the second X chromosome will make no difference.
Examples of X-linked dominant inheritance in humans include a form of rickets, in which problems with phosphate absorption lead to bone deformity and soft teeth. A second example is Rett syndrome, which is characterized by a number of neurological challenges including differences in language development and coordination, as well as short stature.
XD traits tend to affect chromosomal females more often than males in a population, since XX females have twice as many X chromosomes as XY males. Although it can be difficult to distinguish between AD and XD pedigrees, often XD pedigrees show more affected females than males. Equal numbers of males and females are not, however, sufficient to rule out XD inheritance. An example of a pedigree that is consistent with X-linked dominant inheritance is shown in Figure 5.

XD inheritance can be ruled out if two unaffected parents have a child with the trait. Because fathers do not pass X chromosomes to their sons (except in rare cases of a son who inherits an extra sex chromosome), X-linked dominance can be ruled out if a trait is transmitted from father to son. XD inheritance can also be ruled out if an affected father has an unaffected daughter.
Autosomal dominant (AD) inheritance
Assuming complete penetrance, the most characteristic feature of an autosomal dominant pedigree is that every child who has the trait also has an affected parent with the trait. This is because every individual with the allele will display the trait. Any offspring with the trait must get the allele from a parent, so the parent must also show the trait.
Pedigrees tracking autosomal dominant traits show affected individuals in every generation, tracking up through older generations, assuming complete penetrance. However, keep in mind that it is possible that an AD trait vanishes in younger generations: parents who are Aa (affected) and aa (unaffected) can certainly have aa (unaffected) children! An example of a pedigree from an autosomal dominant trait is shown in Figure 6. Note that there are no affected individuals in the fourth (youngest) generation. This kind of pattern is often seen with dominant traits. It means that the affected father, who is heterozygous, did not pass down the affected allele to his children.

Huntington’s disease and polydactyly (extra fingers and toes) are examples of human traits that are inherited in an autosomal dominant fashion. People with either Huntington’s disease or polydactyly have a parent affected by the trait as well. But they only have a 50% chance of passing the affect allele to their children, so they may not have children with the trait.
Note: other modes of inheritance can also show a similar pattern with the trait in every generation: for both Y-linked and mitochondria pedigrees, all affected children also have an affected parent.
Autosomal dominant pedigrees usually show roughly equal numbers of males and females affected by the phenotype. But an overabundance of one sex of the other is not sufficient on its own to rule out autosomal dominance. Assuming complete penetrance, autosomal dominant inheritance can be ruled out if an affected individual does not have an affected parent.
Test Your Understanding
X-linked recessive (XR) inheritance
Recall that chromosomal males have only one X chromosome, while chromosomal females have two. Males are hemizygous for all X-linked genes. Because of this, if a chromosomal male inherits an X-linked recessive allele, he will show the trait. There is no second copy to dominate. Because of this, X-linked recessive traits often affect more males than females in a population. Examples of XR traits in the human population include red-green colorblindness, some forms of muscular dystrophy, and some forms of immunodeficiency. In all of these example cases, it is more common for boys to be affected by the trait than girls in the general population.
It is very common for a pedigree tracking an X-linked recessive trait to show mostly (or even only) males affected. While it can be tempting to look at such a pedigree and infer a Y-linked mode of inheritance, remember that Y-linked inheritance requires that affected sons have affected fathers. This will not be the case for XR inheritance, since sons inherit the X chromosome from their mothers. A typical XR pedigree is shown in Figure 7.

In contrast, both sexes tend to be affected equally by autosomal recessive and autosomal dominant inherited traits, while females are more frequently affected by XD traits. Distribution of sexes alone is not sufficient to infer a mode of inheritance. Additional information must be extracted from the pedigree.
XR inheritance can be ruled out if we see an affected daughter with an unaffected father. A daughter affected with an X-recessive trait must have genotype XaXa, which means her father must have genotype XaY to pass it down. He must also be affected by the phenotype. X-recessive inheritance can also be ruled out if an affected mother (who must have genotype XaXa) has an unaffected son (since it is not possible for such a son to inherit genotype XAY from his parents).
Test Your Understanding
Autosomal recessive (AR)
For diploid organisms, autosomal recessive traits are only expressed if an individual receives recessive alleles from both parents. An unaffected carrier of a trait (sometimes just called a carrier) is a person who has the recessive allele but does not show the trait. Unaffected carriers are heterozygous, but they can pass on the recessive allele to their offspring.
A pedigree of a rare AR trait often shows fewer affected individuals, and the trait may “skip” a generation, meaning that an affected child does not have an affected parent.

An example of an AR pedigree is shown in Figure 8. As is typical of a rare AR trait, most affected individuals do not have an affected parent. However, this is not a requirement for AR inheritance: note that it’s possible for affected children to also have an affected parent.
Test Your Understanding
It can be difficult to rule out AR as a mode of inheritance. For example, even if a trait appears in every generation of a pedigree – all affected children having an affected parent – AR cannot be ruled out. It just would require multiple individuals, through several generations, all carrying the same allele associated with the trait. This is illustrated in Figure 9. For a rare allele in the general population, this is unlikely, but not impossible.

However, if two individuals with the trait (genotype aa) have children together, it is expected that all of their children will have the trait as well (because only genotype aa is possible in their offspring). If two affected individuals have an unaffected child, this rules out AR as a possible mode of inheritance.
Possible vs most likely
The examples given above allow you to rule out modes of inheritance. In many cases, though, the small amount of data provided in a pedigree will leave you with multiple possible modes of inheritance. In those cases, it’s necessary to determine which is the most likely mode of the remaining options.
After ruling out all impossible modes, if fathers always match sons and no females are affected, it is likely to be Y-linked. It would be very unusual to see such a pattern with other modes of inheritance: autosomal traits would be expected to show even numbers of male and female. Thus, if fathers always match sons, and no females are affected, Y-linked is the most likely mode of inheritance.
After ruling out all impossible modes, if there is a great discrepancy between the number of affected females and males, it is most likely that the mode is sex-linked rather than autosomal. This is because we would expect a roughly even distribution of affected males vs affected females for a sex-linked trait.
After ruling out all impossible modes, if all affected children have an affected parent, it is most likely that the mode is dominant rather than recessive. This is because it would be relatively uncommon for multiple unrelated individuals with the same rare recessive allele to join a family, which is necessary for the parents of every affected individual. The exception is if the pedigree involves a consanguineous mating, or a mating between individuals who are blood relations.
Rare recessive disorders are common in families with consanguineous matings. This is due to the fact that almost everyone carries one or more rare recessive alleles. But the phenotype does not manifest in offspring unless a mate also carries the same rare recessive alleles. For the most part, it is very uncommon for partners to share the same rare allele, so the phenotypes remain rare in the general population. However, consanguineous partners are far more likely to share the same rare alleles – they’ve inherited them from the same ancestors. An example of this is seen in Figure 10.

In human populations (and in other species), distinctive genetic traits may be observed in populations where consanguineous relationships are common. A classic example, cited in many genetics textbooks, is the Habsburg jaw, a distinctive protrusion of the lower jaw. It was so-named from its frequency among the Habsburg royal family in Europe, and likely persisted among family members due to interbreeding over many generations.
Test Your Understanding
Real pedigrees are usually more complicated
In this module, straightforward examples of pedigrees are given, assuming complete penetrance of a trait caused by a single gene. In “real-life” practice, however, determining the mode of inheritance is complicated by traits that are incompletely penetrant, variably expressive, or multifactorial. Incomplete penetrance can make a dominant trait appear to skip a generation, variable expressivity can complicate identification of a phenotype, and multifactorial traits can be attenuated by other genes or non-genetic factors. If members of a family are deceased, it can also be difficult to identify whether they had been affected by a trait, given that the identification may rely on the memory of family members.
Figure 11 shows examples of pedigrees adapted from an early paper tracking celiac disease in families[4]. The authors of the paper, David and Ajdukiewicz, tracked 13 families total: 4 pedigrees are reproduced here. This paper draws pedigrees using an alternative convention where unrelated partners are not shown in the pedigree. We can presume that they do not show signs of celiac disease.
Figure 11 Pedigrees from David and Ajdukiewicz, 1975, tracking celiac disease in several unrelated families.
In the full paper, of the 36 children born to a parent with celiac disease, 14 also have the disease (~39%). For a dominant trait, we would expect about 50% of offspring to also show the trait. However, none of the oldest generation have the trait in any of these four pedigrees. Because a dominant trait would normally require affected children to have an affected parent, one possible conclusion is that this is an incompletely penetrant trait. Notably, in pedigree J, the only affected individuals are twins (presumed in the paper to be identical twins).
Because of the number of pedigrees that show similar patterns – only one parent has a family history of the relatively rare disease – David and Ajdukiewicz ruled out a simple autosomal recessive pattern of inheritance, since it would require so many unrelated individuals to carry a rare allele associated with celiac disease.
The authors of the paper stated that the pedigrees matched what would be expected from an incompletely penetrant, dominant condition, but described their contemporary (1975) understanding of celiac disease as heterogeneous. This still holds true at present, with an imperfect understanding of the inheritance of a multifactorial disease that’s influenced by both genetic and non-genetic factors.
Calculating Probabilities from Pedigrees
Pedigree analysis can also be used to calculate risk. If the mode of inheritance of a trait is known, we can use information about others in the family to calculate the likelihood that another individual will develop the trait. This is useful in situations like genetic counseling: if a couple comes to a genetic counselor due to a family history of a genetic disorder, what is the risk that their child will also suffer from the disorder?
If the mode of inheritance is known, it’s often possible to assign probable genotypes to some individuals in the pedigree, based on their phenotypes and relationships to others in the pedigree. For example, all individuals affected by an autosomal recessive trait have genotype “aa”, and any of their offspring who are unaffected by the trait must have genotype “Aa”. With this information, it’s then possible to calculate the probability of other individuals either having the allele (being unaffected carriers) or having kids with the trait. This makes pedigrees an important tool in genetic counseling if, for example, parents with a family history of a genetic disease would like to know the likelihood of passing the disease to their child.
The rules of probability – and the laws of Mendelian inheritance – make these calculations possible. Remember from earlier modules, we used two rules of probability: the multiplication rule of probability and the addition rule of probability. The multiplication rule of probability states that the probability of two independent events occurring is the product of the probability of each event occurring independently. For example, in a cross between parents of genotypes Aa and Aa, the probability of having a child with phenotype A and a child with phenotype a is ¾ * ¼ = 3/8.
The addition rule of probability states that the probability of one event or another is the sum of their individual probabilities. In a cross between parents of genotypes Aa and Aa, the probability of having a child of genotype AA or Aa is ¼ + ½ = ¾.
In many of these complex family pedigrees, in order for a child to have a particular trait, the allele for the trait must be passed down from multiple individuals, often through several generations. But because all of these inheritance events must happen, we use the multiplication rule to calculate the combined probability.
When calculating the probabilities for a rare trait in the general population, unless there is evidence otherwise in the pedigree, we usually assume that unrelated individuals who are joining the family do not carry the same rare allele that “blood” relatives do, since this would be a pretty unlikely occurrence.
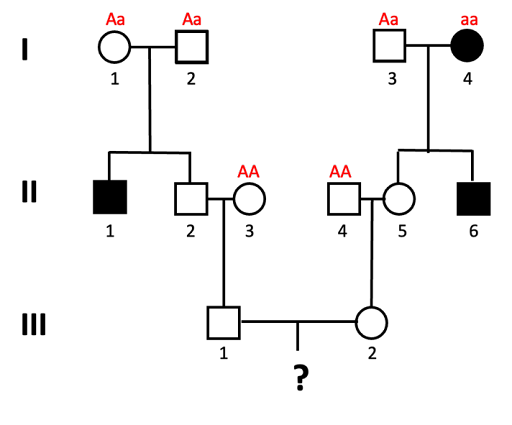
An example of this is shown using the pedigree shown in Figure 12. What is the probability that a child of III-1 and III-2 will be affected by the autosomal recessive trait?
We solve this type of problem by determining the genotypes of the direct ancestors to the individual for whom we will calculate the probability. The next figures walk through this process, step by step. Let’s assume the allele associated with the recessive trait is “a”.
- We can assign genotypes to all of the individuals in generation I.
Individuals I-1 and I-2 must both have genotype Aa, since they have an affected child (II-1) who is presumed to have genotype aa. This is also true for individual I-3, who has a child with the trait as well. I-4 has the genotype aa, since they have the trait.
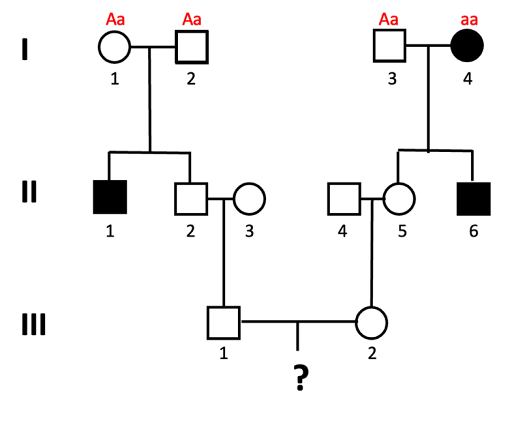
- Since this is a rare trait in the population, in Generation II we assume that individuals II-3 and II-4 do not carry the allele (they have genotype AA).
![]()
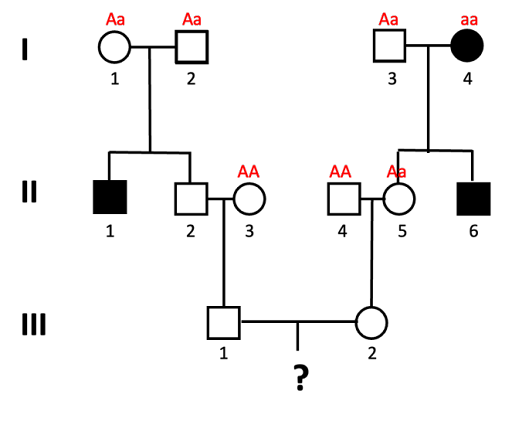
- Individual II-5 must have genotype Aa, since she inherits a dominant (unaffected) allele from her dad, but must inherit the recessive allele from mom.
![]()
- What about individual II-2? In order for our final offspring to show the trait, individual II-2 must be a carrier of the “a” allele.
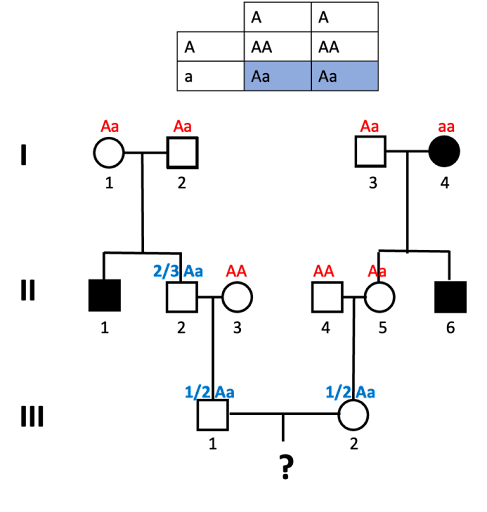
What’s the probability that they inherited the “a” allele? Well, let’s look at the Punnett Square expected from Aa x Aa parents (which is what individual II-2 has). This requires a bit of tricky reasoning: it might be tempting to say that ½ are Aa, but that is incorrect. We know that II-2 does not have an aa genotype because II-2 does not show the trait. Of the remaining possibilities, 2/3 are Aa.
![]()
-
- In generation III, we likewise need to determine the probability of III-1 and III-2 carrying the allele. We do this as we did for II-2: we draw a Punnett square to illustrate the cross, and determine which fraction of offspring carry the allele. For both III-1 and III-2, there is a ½ probability that they will carry the allele (and have the Aa genotype).
![]()
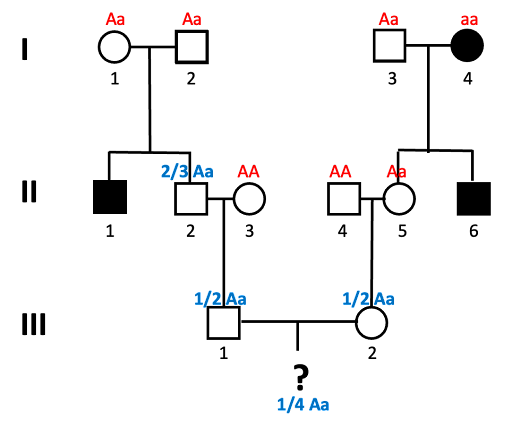
- Lastly, we can’t forget the child! A Punnett square of Aa x Aa shows that there is a ¼ chance of aa offspring.
![]()
In order for the child of III-1 and III-2 to show the trait, all these four things shown in blue in the images must be true: II-2 must be Aa, III-1 must be Aa, III-2 must be Aa, and the child must be aa. We use the multiplication rule to determine the overall probability: 2/3 * 1/2 *1/2 * 1/4 = 2/48.
Some things to keep an eye out for, as you solve these problems: it’s very common to forget the last step: the probability of the final offspring showing the trait! Don’t forget to do this, even if there isn’t a symbol representing the unborn child. And watch out for those Aa x Aa crosses, where you can rule out aa as a possible genotype. 2/3 of the possible unaffected offspring are Aa, not ½.
Media Attributions
- Pedigree examples © Amanda Simons is licensed under a CC BY-SA (Attribution ShareAlike) license
- Pedigree symbols © Amanda Simons is licensed under a CC BY-SA (Attribution ShareAlike) license
- Y-linked inheritance © Amanda Simons is licensed under a CC BY-SA (Attribution ShareAlike) license
- X-linked dominant inheritance © Amanda Simons is licensed under a CC BY-SA (Attribution ShareAlike) license
- X-linked dominant © Amanda Simons is licensed under a CC BY-SA (Attribution ShareAlike) license
- Autosomal dominant inheritance © Amanda Simons is licensed under a CC BY-SA (Attribution ShareAlike) license
- X-linked recessive inheritance © Amanda Simons is licensed under a CC BY-SA (Attribution ShareAlike) license
- Autosomal recessive pedigree © Amanda Simons is licensed under a CC BY-SA (Attribution ShareAlike) license
- Autosomal recessive in every generation © Amanda Simons is licensed under a CC BY-SA (Attribution ShareAlike) license
- High incidence of autosomal recessive traits © Amanda Simons is licensed under a CC BY-SA (Attribution ShareAlike) license
- Celiac disease tracking © Amanda Simons is licensed under a CC BY-SA (Attribution ShareAlike) license
- Pedigree tracking © Amanda Simons is licensed under a CC BY-SA (Attribution ShareAlike) license
- Pedigree tracking step 1 © Amanda Simons is licensed under a CC BY-SA (Attribution ShareAlike) license
- Pedigree tracking step 2 © Amanda Simons is licensed under a CC BY-SA (Attribution ShareAlike) license
- Pedigree tracking step 3 © Amanda Simons is licensed under a CC BY-SA (Attribution ShareAlike) license
- Pedigree tracking step 4 © Amanda Simons is licensed under a CC BY-SA (Attribution ShareAlike) license
- Pedigree tracking step 5 © Amanda Simons is licensed under a CC BY-SA (Attribution ShareAlike) license
- Pedigree tracking step 6 © Amanda Simons is licensed under a CC BY-SA (Attribution ShareAlike) license
- Sheehan, E., Bennett, R. L., Harris, M. & Chan-Smutko, G. Assessing transgender and gender non-conforming pedigree nomenclature in current genetic counselors’ practice: The case for geometric inclusivity. J. Genet. Couns. 29, 1114–1125 (2020). ↵
- Tuite, A., Dalla Piazza, M., Brandi, K. & Pletcher, B. A. Beyond circles and squares: A commentary on updating pedigree nomenclature to better represent patient diversity. J. Genet. Couns. 29, 435–439 (2020). ↵
- Maan, A. A. et al. The Y chromosome: a blueprint for men’s health? Eur. J. Hum. Genet. 25, 1181–1188 (2017). ↵
- David, T. J. & Ajdukiewicz, A. B. A family study of coeliac disease. J. Med. Genet. 12, 79–82 (1975). ↵
