
Sex vs Gender
It is important to note that, to this point, we have been discussing sex, not gender. Although the terms are sometimes used interchangeably, sex and gender refer to two different ideas. According to the American Psychological Association: ”Sex is typically assigned at birth (or before during ultrasound) based on the appearance of external genitalia. When the external genitalia are ambiguous, other indicators (e.g., internal genitalia, chromosomal and hormonal sex) are considered to assign a sex, with the aim of assigning a sex that is most likely to be congruent with the child’s gender identity.” Gender is “a person’s deeply felt, inherent sense of being a girl, woman, or female; a boy, a man, or male; a blend of male or female; or an alternative gender[1].”
Just like there are many individuals for whom chromosomal, hormonal, gonadal, and anatomical sex do not align, so too are there individuals whose innate gender identity or gender expression differs from their phenotypic sex as determined by external genitalia. This is called transgender. Individuals for whom their gender identity is the same as their phenotypic sex are cisgender.
Historically, the biology of gender has not been as well studied as sex, and, as such, it is poorly understood. However, a number of studies provide strong evidence that gender is innate, with both genetic and other biological causes. For example, transgender individuals may have brain structures that more closely match their gender than their phenotypic sex. A majority of individuals with 5-alpha-reductase deficiency choose to live as male after puberty, despite culturally having been raised as female to that point. XY babies with abnormal genitalia who are surgically assigned a female sex (a practice more common in previous decades) have a much higher incidence of transgender. And twin studies and adoption studies – standard ways to determine whether genetic factors affect a trait – strongly suggest a genetic component to gender. Twin studies and adoption studies are discussed in a later module.
Sex-determination vs sex-linked vs sex-influenced genes
In the previous section, we looked at sex-determination genes: genes that are responsible for the development of sex-associated structures in the developing embryo. SRY, Sox9, and RSPO1 are three examples mentioned previously. Sex-determination genes are not necessarily carried on the sex chromosomes: for example, both Sox9 and RSPO1 are encoded by autosomes. Other traits may be influenced by sex, but encoded by genes on autosomes. For example, male pattern baldness – also called androgenetic alopecia – appears to be linked with several autosomal loci. All sexes may experience alopecia (baldness), but androgens appear to influence the progression of hair loss, making the trait appear more often in hormonal males than hormonal females. Androgenic alopecia is thus an example of a sex-influenced trait. Some traits that are influenced by sex are actually limited by sex: many secondary sex characteristics fall in this category. Ovarian cancer would be an example of a sex-limited trait, since it only affects individuals with ovaries (gonadal females).
But what about genes located on the sex chromosomes? The sex chromosomes, especially the X chromosome, carry many genes that do not affect either sex-determination or sex-influenced traits. These are called sex-linked genes. Sex-linked traits are those that are encoded by genes on the sex chromosomes. Most of these sex-linked genes have functions that have nothing to do with sex-associated phenotypes.
The Y-chromosome is small and has few genes. True Y-linked traits are very rare, but only chromosomal males would ever display Y-linked traits. There are no dominant or recessive Y-linked traits, since most individuals have only one copy of the Y chromosome.
X-linked traits are more common, since the X chromosome carries about 900 genes[2]. Although chromosomal females are diploid for X-linked genes, males are haploid for X-linked genes. Because chromosomal males and females have different numbers of sex chromosomes, inheritance of sex-linked traits does not follow standard rules of Mendelian inheritance. Genetic crosses tracking sex-linked traits show differences in phenotypes among male and female offspring.
Test Your Understanding
X-Linked Gene example: the white gene in Drosophila melanogaster
The first examples of X-linked traits came from studies in Drosophila melanogaster, the common fruit fly. In the early 1900’s, Thomas Hunt Morgan followed up on Mendel’s work in pea plants, using fruit flies as a model organism. Like peas, fruit flies were easy to grow with a short generation time (about two weeks). Different phenotypes could also be easily identified.
Normally, fruit flies have red eyes, so the red eye phenotype is considered wild type. Morgan found a fly with white eyes. The white eye phenotype was heritable. Morgan named the mutated gene “white”, and described the wild-type allele as “w+” and the mutant allele “w-“. Note the deviation from the capital/lowercase notation that Mendel used: even today, geneticists may describe wild-type alleles as “+” and mutant alleles as “-“.
The white phenotype did not appear to follow Mendel’s predictions for inheritance. Instead, different offspring ratios were observed for reciprocal crosses: a white female crossed with a wild-type male gave different offspring than a cross between a wild-type female and white male. Morgan was able to conclude that this was because the gene was linked to the X chromosome. More than a century later, we now know that the mutation in the white gene prevents the flies from synthesizing the (many) pigments that contribute to red eye color.
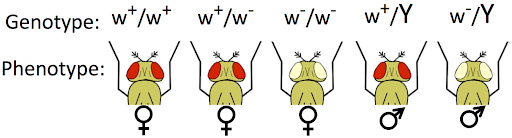
The white phenotype is recessive to wild-type: a heterozygous individual can produce pigment and its eye color is red. But because male flies (XY) only have one copy of the X chromosome, they always express the phenotype determined by that one allele. Female flies can be homozygous for the wild-type allele, heterozygous, or homozygous for the white allele. This is illustrated in Figure 8.
To better distinguish sex-linked genes from autosomal genes, we can use a modification of standard genetic notation for dominant and recessive alleles. While dominant or recessive autosomal alleles are typically indicated by capital or lowercase letters, respectively, if we want to indicate that a gene is X-linked we would use an X and a superscript to indicate the allele: XW or Xw; Xw+ or Xw-
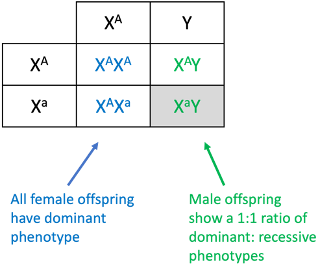
We can likewise use a modified Punnett square, which will allow us to visually depict differences between male and female offspring. This is shown in Figure 9, below, where the two X chromosomes from the female parent are listed to the left, the X and Y from the male parent is across the top, and we can see the offspring include two dominant females, one dominant male, and one recessive male. This is an offspring ratio of 1:1 for males, but all dominant for females. Differing offspring ratios for males and females is characteristic of a sex-linked trait.
Test Your Understanding
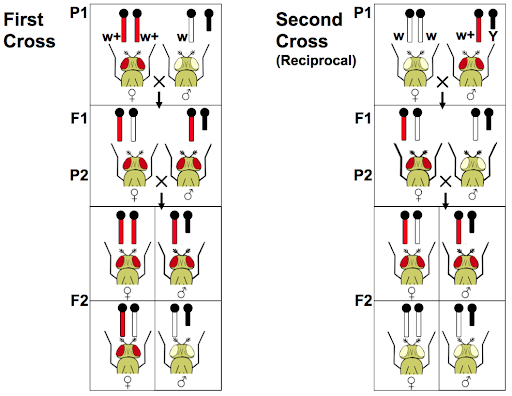
Crosses that track sex-linked traits often show different phenotype ratios among male and female offspring. In addition, reciprocal crosses of sex-linked traits may show different offspring ratios. Reciprocal crosses test the influence of parental sex toward the offspring phenotypes. For example, a male of phenotype A might be crossed with a female of phenotype B (AxB), and in the reciprocal cross a male of phenotype B might be crossed with a female of phenotype A (BxA). Traits that follow Mendelian patterns of inheritance show no difference in reciprocal crosses, but sex-linked genes do.
Morgan’s results with the white flies demonstrate the results of a reciprocal cross (Figure 10). In the first cross, a male with the mutant phenotype is crossed with a wild-type female. In the second cross, a female with the mutant phenotype is crossed with a wild-type male. The two crosses showed different offspring phenotypes.
When male and female offspring from a single cross show distinct phenotypes, or if reciprocal crosses give different offspring phenotypes, a sex-linked gene is often the cause.
Dosage Compensation
As for autosomal traits, X-linked traits often show incomplete dominance, codominance, variable expressivity, or incomplete penetrance. For many traits, molecular mechanisms of dosage compensation cause these types of phenotypes.
What is meant by dosage compensation? Because chromosomal males have only one copy of the X chromosome, and chromosomal females have two copies of the X chromosome, it would be expected that chromosomal females produce twice as much protein product from X-linked genes as do chromosomal males. This could be problematic, since the amount of protein produced can affect phenotype, and most genes on the sex chromosomes are not sex-related. However, it turns out that males and females do generally produce similar amounts of protein product from sex-linked genes. This is because most species with sex chromosomes use some form of dosage compensation, which normalizes the amount of expression from the sex chromosomes so that there is no difference in protein produced in males and females.
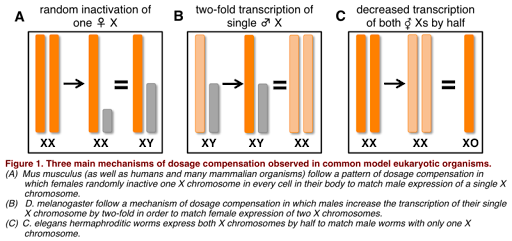
Dosage compensation works differently in different species, as illustrated in Figure 5. For example, in the fruit fly D. melanogaster, the X chromosome is hyper-transcribed: it is transcribed twice as often in males as it is in females. This results in similar amounts of RNA produced in males and females, and similar levels of protein. In the round worm C. elegans, however, the opposite is true: X chromosomes in XX individuals are hypo-transcribed, or transcribed half as much as in individuals with only one X chromosome. (C. elegans has no Y chromosome, and the genotype is written as XO to indicate there is only one sex chromosome.)

Mammals use a process called X inactivation to compensate. In each cell with more than one X chromosome, the “extra” X chromosomes are inactivated by packaging the DNA into tightly packed heterochromatin, full of chromatin modifications that make the chromosome inaccessible to transcription machinery. This is a form of epigenetic modification, as the chromatin modifications (and the X-inactivation) is inherited by mitotic daughter cells. Epigenetics is discussed in more detail in a separate module.
Interestingly, for individuals with additional copies of the X-chromosome (for example XXY or XXXX) all but one X chromosome will typically be silenced. This silencing may explain why sex chromosome aneuploidies typically cause few phenotypic effects: extra copies of X-linked genes are not expressed. Autosomal aneuploidies, on the other hand, are far less common, because an extra copy of an autosome affects the overall level of expression of nearly every gene on the chromosome.
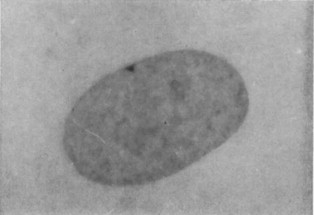
The tightly packed X chromosome is called a Barr body, and it is clearly visible by light microscopy. This is shown in Figure 6. The alleles on the inactivated X-chromosome are never expressed, leaving only one protein-producing X chromosome per cell.
Which X chromosome is inactivated is mostly random, with the maternal X inactivated in some cells of a developing embryo and the paternal X inactivated in others. Inactivation appears to happen early during embryo development. As the cells of the embryo continue to divide, cells with an inactive X chromosome give rise to cells that have the same inactivated X-chromosome. In the mature organism, this results in patches of cells that all have the same X-chromosome expressed (and the same one silenced).
Calico cats
The expression of a fur color gene on the X-chromosome in cats gives a striking visual depiction of X-inactivation. This fur color gene O exists in two alleles: one that encodes black pigment, OB, and one that encodes orange, OO. Male cats generally only have one X chromosome and one allele. Female cats, with two X chromosomes, can be heterozygous for both orange and black. Due to inactivation of the maternal X in some cells and the paternal X in other cells, such heterozygous XX cats end up with both black and orange fur in a patchwork of orange and black. This patterning is called “calico” or “tortoiseshell” patterning as shown in Figure 11a. A tortoiseshell cat is shown in Figure 11b. (Calico cats have a white background color that is due to the action of a separate gene.)
To tie this back to terminology used in other chapters of this text: the orange and black alleles are codominant, since both are visible in the phenotype, and X-inactivation explains the mechanism of co-dominance. Note the unusual notation to describe the alleles: rather than use a capital and a lowercase letter, the alleles are both described by a capital letter with a superscript distinguishing the alleles from each other.
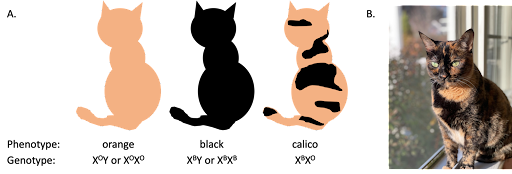
Tortoiseshell and calico cats are nearly always female. Notably, fewer than 1/1000 calico cats are male. Those rare male calico cats often have extra copies of their sex chromosomes: for example, an XXY or XXXY karyotype[3].
Examples in humans
The Orange gene in cats is a good visual demonstration of how the mammalian dosage compensation system affects gene expression. However, most X-linked genes do not produce such striking mosaic phenotypes in heterozygous females. For most X-linked alleles, provided that some cells are expressing the dominant allele, a heterozygous individual will have a dominant phenotype. Two examples are the F8 gene encoding Factor VIII, a protein important for blood clotting, and the green cone pigment gene (GCP) that participates in color vision.
Hemophilia A is a bleeding disorder associated with certain loss of function alleles of the F8 gene. The F8 gene is normally expressed in liver cells and released into the bloodstream, where it plays an important role in blood clotting. Patients with hemophilia A have impaired blood-clotting ability and are prone to excessive bleeding, both spontaneously and after injury. This can be life-threatening.
Like most X-linked recessive traits, hemophilia A Is much more common in XY individuals than in XX individuals, since XY individuals need only one copy of the disease-associated allele to have the phenotype. XX individuals heterozygous for the recessive hemophilia-associated allele typically do not have hemophilia, even though only half (on average) of their liver cells produce Factor VIII protein. About half of their liver cells inactivate the healthy allele, and half of the cells inactivate the allele associated with hemophilia. The cells with the active healthy X chromosome release enough Factor VIII into the bloodstream to prevent excessive bleeding.
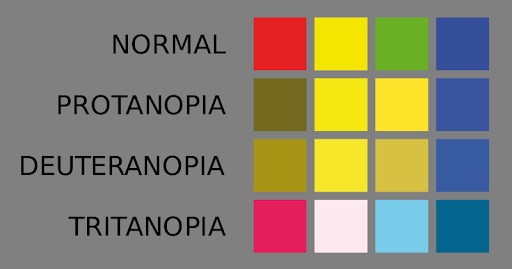
A second example is impaired color vision (or color blindness). In the eye, photoreceptor cells called “rods” and “cones” detect light. Rod photoreceptors are highly sensitive and function well in conditions of low light, while cone photoreceptors detect different wavelengths of light (different colors) but are less sensitive under low light conditions. Humans typically have three types of cones, each of which senses a different spectrum of light best (short, medium, or long wavelength). The short, medium and long wavelength cones are sometimes called blue cones, green cones, and red cones, respectively, named for the color of light to which they are most sensitive. Color vision is a result of the brain’s interpreting a combination of signals from all three types of cones.
The three types of cones sense different wavelengths of light due to the expression of different cone pigment proteins (called “opsins”). For some individuals with impaired color vision, the gene sequence of one of the cone pigments is altered, resulting in two pigments that sense similar wavelengths of light. This makes such people less able to distinguish between colors. Others with impaired color vision may be missing one of the cone pigment genes entirely – they are missing an entire segment of the chromosome![4]
Figure 14 approximates what is seen by individuals with three forms of color blindness, caused by differences in each of the three cone pigments.
Both the red cone pigment gene and the green cone pigment gene are found on the X chromosome.
Chromosomal males who inherit one recessive allele of the green cone pigment gene have defective cone photoreceptor cells and cannot distinguish between certain shades of red and green. Chromosomal female heterozygotes usually have normal color vision, although there are some exceptions to this. As long as an XX individual retains some photoreceptor cells that express the healthy cone pigment allele, that person will be able to distinguish colors with a sensitivity close to that of someone with two healthy alleles. However, there are rare examples of heterozygotes with impaired color vision due to X-inactivation that is highly skewed toward the inactivation of the healthy allele[5]. This is similar to a calico cat that is mostly black with only a few orange patches (which can happen too).
Red-green colorblindness is one of the most common examples of X-linked recessive traits in humans. The trait seems to be most common among people of European descent, where up to 8% of males have some difficulty distinguishing between red and green. It is less common among people of other geographic ancestry; for example, some estimate about 5% of males of Chinese and Japanese descent and less than 4% of males of African descent have some form of red-green colorblindness[6].
Test Your Understanding
Media Attributions
- Genotype and phenotype © Open Online Genetics, Nickle and Barrette-Ng. is licensed under a CC0 (Creative Commons Zero) license
- Punnett Square of an X-linked gene © Amanda Simons is licensed under a CC BY-SA (Attribution ShareAlike) license
- Reciprocal crosses © Online Genetics, Nickle and Barrette-Ng. is licensed under a CC0 (Creative Commons Zero) license
- Three main dosages © CarmenMariaConroy via. Wikipedia is licensed under a CC BY-SA (Attribution ShareAlike) license
- Sex-chromatin body © Barr Body is licensed under a CC BY-NC-SA (Attribution NonCommercial ShareAlike) license
- Alleles of the O gene © Amanda Simons is licensed under a CC BY-SA (Attribution ShareAlike) license
- Comparison of the colors © Japs 88 via. Wikipedia is licensed under a CC0 (Creative Commons Zero) license
- American Psychological Association. Guidelines for psychological practice with transgender and gender nonconforming people. American Psychologist 70, 832–864 (2015). ↵
- X chromosome: MedlinePlus Genetics. https://medlineplus.gov/genetics/chromosome/x/. ↵
- Pedersen, A. S., Berg, L. C., Almstrup, K. & Thomsen, P. D. A tortoiseshell male cat: chromosome analysis and histologic examination of the testis. Cytogenet Genome Res 142, 107–111 (2014). ↵
- Deeb, S. The molecular basis of variation in human color vision. Clinical Genetics 67, 369–377 (2005). ↵
- Jørgensen, A. L. et al. Different patterns of X inactivation in MZ twins discordant for red-green color-vision deficiency. Am J Hum Genet 51, 291–298 (1992). ↵
- Deeb, S. The molecular basis of variation in human color vision. Clinical Genetics 67, 369–377 (2005). ↵
